Immigrants from Croatia vs Ecuadorian Unemployment
COMPARE
Immigrants from Croatia
Ecuadorian
Unemployment
Unemployment Comparison
Immigrants from Croatia
Ecuadorians
5.1%
UNEMPLOYMENT
86.8/ 100
METRIC RATING
131st/ 347
METRIC RANK
6.2%
UNEMPLOYMENT
0.0/ 100
METRIC RATING
288th/ 347
METRIC RANK
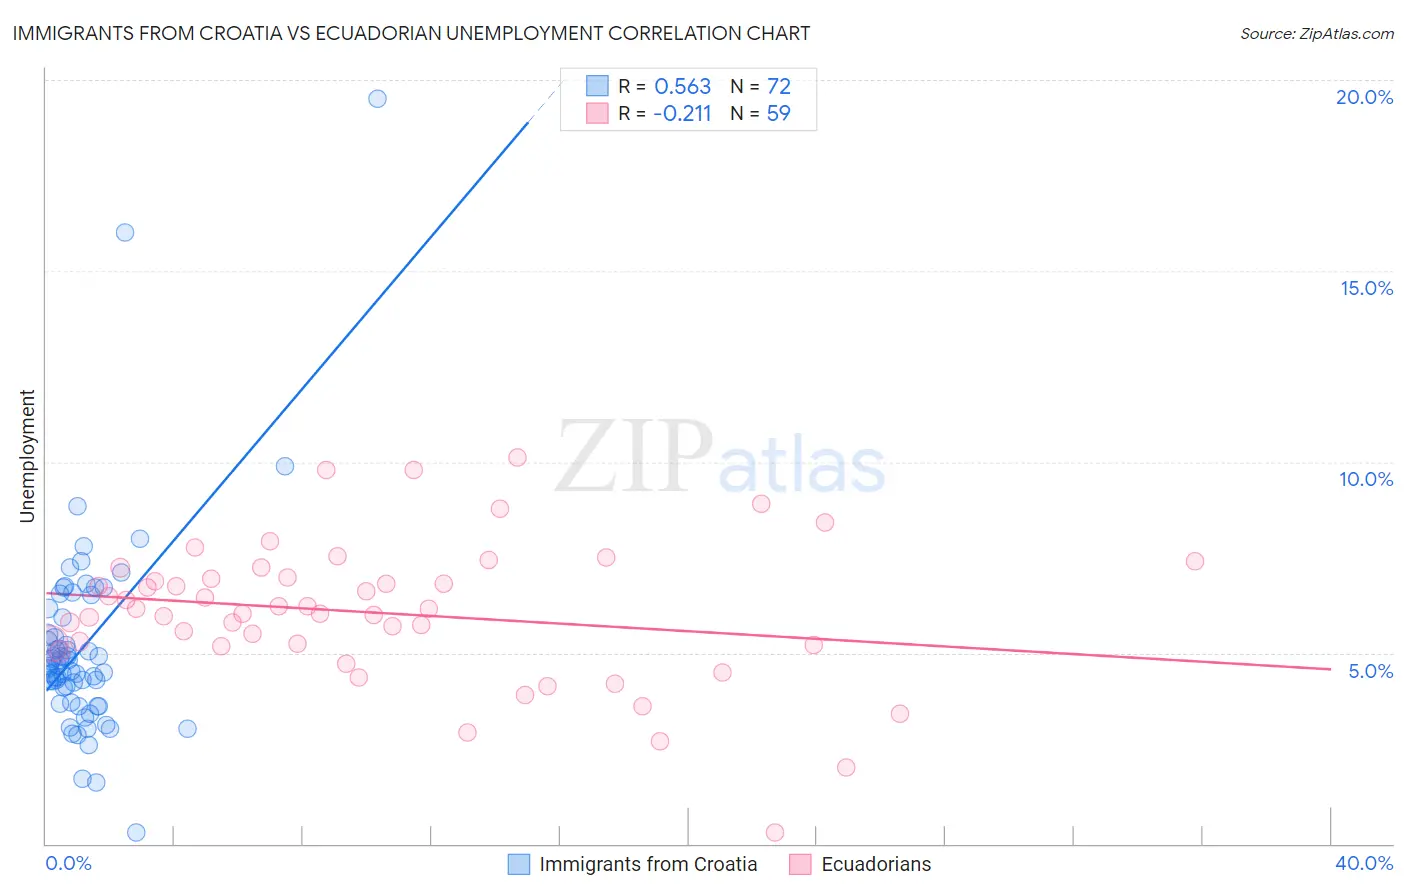
Immigrants from Croatia vs Ecuadorian Unemployment Correlation Chart
The statistical analysis conducted on geographies consisting of 132,546,929 people shows a substantial positive correlation between the proportion of Immigrants from Croatia and unemployment in the United States with a correlation coefficient (R) of 0.563 and weighted average of 5.1%. Similarly, the statistical analysis conducted on geographies consisting of 317,664,443 people shows a weak negative correlation between the proportion of Ecuadorians and unemployment in the United States with a correlation coefficient (R) of -0.211 and weighted average of 6.2%, a difference of 20.9%.
Unemployment Correlation Summary
| Measurement | Immigrants from Croatia | Ecuadorian |
| Minimum | 0.30% | 0.30% |
| Maximum | 19.5% | 10.1% |
| Range | 19.2% | 9.8% |
| Mean | 5.2% | 6.0% |
| Median | 4.7% | 6.2% |
| Interquartile 25% (IQ1) | 3.9% | 5.2% |
| Interquartile 75% (IQ3) | 6.0% | 7.0% |
| Interquartile Range (IQR) | 2.2% | 1.8% |
| Standard Deviation (Sample) | 2.7% | 1.8% |
| Standard Deviation (Population) | 2.7% | 1.8% |
Similar Demographics by Unemployment
Demographics Similar to Immigrants from Croatia by Unemployment
In terms of unemployment, the demographic groups most similar to Immigrants from Croatia are Immigrants from Ethiopia (5.1%, a difference of 0.010%), Immigrants from Jordan (5.1%, a difference of 0.020%), Iranian (5.1%, a difference of 0.030%), Immigrants from Europe (5.1%, a difference of 0.060%), and Immigrants from Burma/Myanmar (5.1%, a difference of 0.070%).
| Demographics | Rating | Rank | Unemployment |
| Ethiopians | 88.6 /100 | #124 | Excellent 5.1% |
| Immigrants | Eastern Asia | 88.3 /100 | #125 | Excellent 5.1% |
| Kenyans | 88.2 /100 | #126 | Excellent 5.1% |
| Immigrants | Kenya | 88.2 /100 | #127 | Excellent 5.1% |
| Immigrants | Eastern Africa | 88.1 /100 | #128 | Excellent 5.1% |
| Immigrants | Latvia | 88.0 /100 | #129 | Excellent 5.1% |
| Iranians | 86.9 /100 | #130 | Excellent 5.1% |
| Immigrants | Croatia | 86.8 /100 | #131 | Excellent 5.1% |
| Immigrants | Ethiopia | 86.7 /100 | #132 | Excellent 5.1% |
| Immigrants | Jordan | 86.6 /100 | #133 | Excellent 5.1% |
| Immigrants | Europe | 86.3 /100 | #134 | Excellent 5.1% |
| Immigrants | Burma/Myanmar | 86.2 /100 | #135 | Excellent 5.1% |
| Immigrants | Spain | 86.2 /100 | #136 | Excellent 5.1% |
| Immigrants | Saudi Arabia | 85.6 /100 | #137 | Excellent 5.1% |
| Immigrants | Hungary | 85.6 /100 | #138 | Excellent 5.1% |
Demographics Similar to Ecuadorians by Unemployment
In terms of unemployment, the demographic groups most similar to Ecuadorians are Nepalese (6.2%, a difference of 0.030%), Chippewa (6.2%, a difference of 0.35%), Immigrants from Caribbean (6.2%, a difference of 0.36%), Senegalese (6.2%, a difference of 0.44%), and Immigrants from Senegal (6.1%, a difference of 0.79%).
| Demographics | Rating | Rank | Unemployment |
| Africans | 0.0 /100 | #281 | Tragic 6.1% |
| Immigrants | Azores | 0.0 /100 | #282 | Tragic 6.1% |
| Immigrants | Ghana | 0.0 /100 | #283 | Tragic 6.1% |
| Aleuts | 0.0 /100 | #284 | Tragic 6.1% |
| Immigrants | Senegal | 0.0 /100 | #285 | Tragic 6.1% |
| Immigrants | Caribbean | 0.0 /100 | #286 | Tragic 6.2% |
| Nepalese | 0.0 /100 | #287 | Tragic 6.2% |
| Ecuadorians | 0.0 /100 | #288 | Tragic 6.2% |
| Chippewa | 0.0 /100 | #289 | Tragic 6.2% |
| Senegalese | 0.0 /100 | #290 | Tragic 6.2% |
| Haitians | 0.0 /100 | #291 | Tragic 6.2% |
| Central American Indians | 0.0 /100 | #292 | Tragic 6.2% |
| Immigrants | Ecuador | 0.0 /100 | #293 | Tragic 6.2% |
| Spanish American Indians | 0.0 /100 | #294 | Tragic 6.2% |
| U.S. Virgin Islanders | 0.0 /100 | #295 | Tragic 6.3% |