Immigrants from Dominican Republic vs Immigrants from Saudi Arabia Unemployment Among Women with Children Ages 6 to 17 years
COMPARE
Immigrants from Dominican Republic
Immigrants from Saudi Arabia
Unemployment Among Women with Children Ages 6 to 17 years
Unemployment Among Women with Children Ages 6 to 17 years Comparison
Immigrants from Dominican Republic
Immigrants from Saudi Arabia
10.8%
UNEMPLOYMENT AMONG WOMEN WITH CHILDREN AGES 6 TO 17 YEARS
0.0/ 100
METRIC RATING
324th/ 347
METRIC RANK
9.3%
UNEMPLOYMENT AMONG WOMEN WITH CHILDREN AGES 6 TO 17 YEARS
2.7/ 100
METRIC RATING
239th/ 347
METRIC RANK
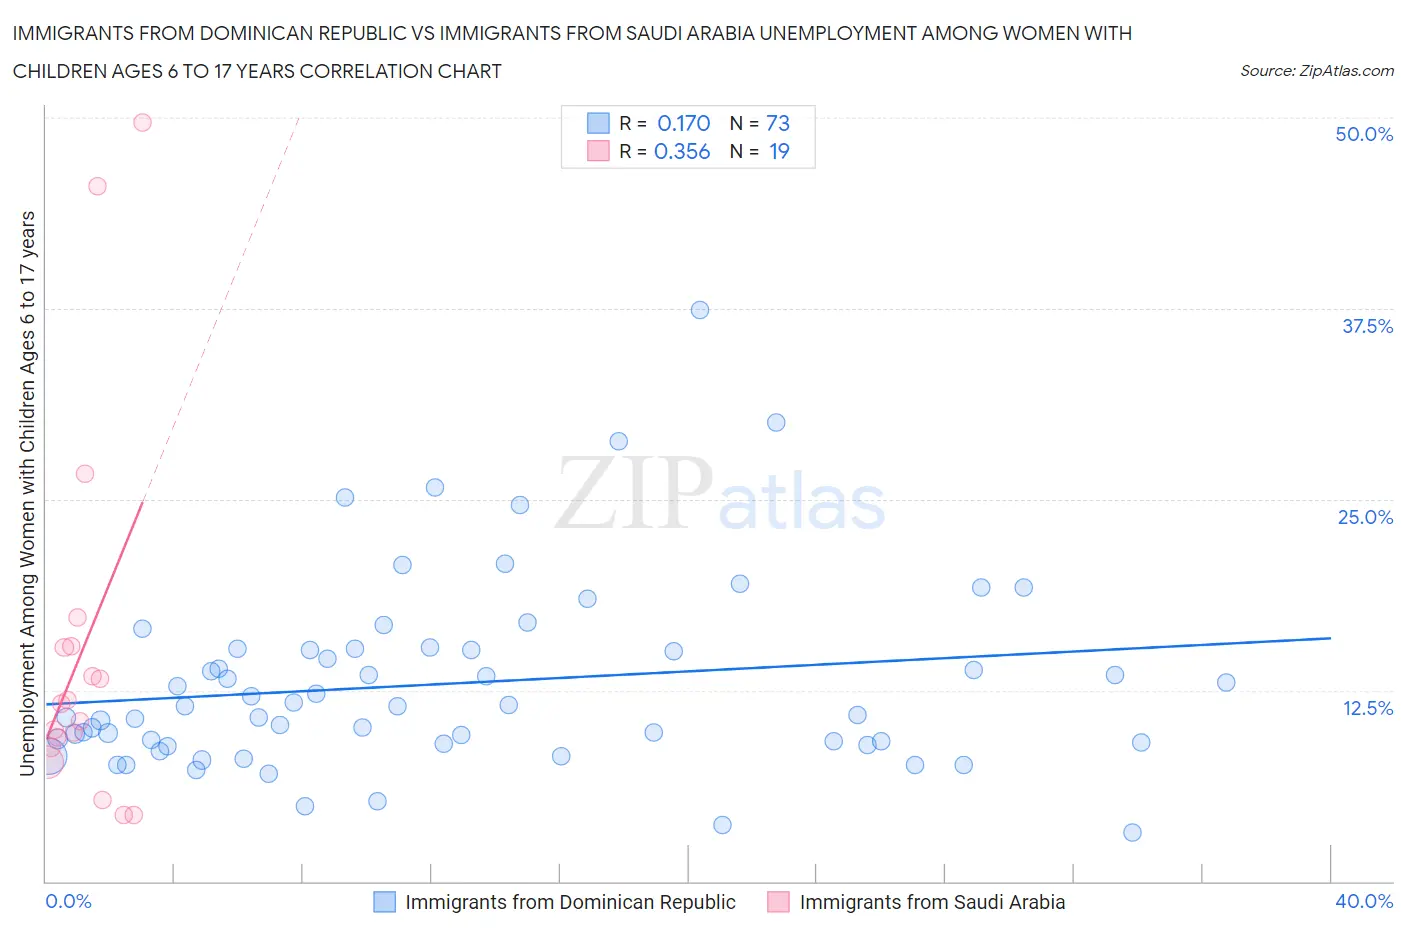
Immigrants from Dominican Republic vs Immigrants from Saudi Arabia Unemployment Among Women with Children Ages 6 to 17 years Correlation Chart
The statistical analysis conducted on geographies consisting of 210,922,335 people shows a poor positive correlation between the proportion of Immigrants from Dominican Republic and unemployment rate among women with children between the ages 6 and 17 in the United States with a correlation coefficient (R) of 0.170 and weighted average of 10.8%. Similarly, the statistical analysis conducted on geographies consisting of 135,443,902 people shows a mild positive correlation between the proportion of Immigrants from Saudi Arabia and unemployment rate among women with children between the ages 6 and 17 in the United States with a correlation coefficient (R) of 0.356 and weighted average of 9.3%, a difference of 16.1%.
Unemployment Among Women with Children Ages 6 to 17 years Correlation Summary
| Measurement | Immigrants from Dominican Republic | Immigrants from Saudi Arabia |
| Minimum | 3.2% | 4.3% |
| Maximum | 37.4% | 49.7% |
| Range | 34.2% | 45.4% |
| Mean | 12.9% | 15.3% |
| Median | 11.5% | 11.6% |
| Interquartile 25% (IQ1) | 9.1% | 8.7% |
| Interquartile 75% (IQ3) | 15.2% | 15.4% |
| Interquartile Range (IQR) | 6.1% | 6.7% |
| Standard Deviation (Sample) | 6.2% | 12.5% |
| Standard Deviation (Population) | 6.2% | 12.2% |
Similar Demographics by Unemployment Among Women with Children Ages 6 to 17 years
Demographics Similar to Immigrants from Dominican Republic by Unemployment Among Women with Children Ages 6 to 17 years
In terms of unemployment among women with children ages 6 to 17 years, the demographic groups most similar to Immigrants from Dominican Republic are Dominican (10.8%, a difference of 0.060%), Cree (10.8%, a difference of 0.11%), Cajun (10.8%, a difference of 0.18%), Liberian (10.8%, a difference of 0.25%), and Cape Verdean (10.9%, a difference of 0.32%).
| Demographics | Rating | Rank | Unemployment Among Women with Children Ages 6 to 17 years |
| Bermudans | 0.0 /100 | #317 | Tragic 10.5% |
| Delaware | 0.0 /100 | #318 | Tragic 10.5% |
| Immigrants | Uganda | 0.0 /100 | #319 | Tragic 10.7% |
| Apache | 0.0 /100 | #320 | Tragic 10.7% |
| Tohono O'odham | 0.0 /100 | #321 | Tragic 10.7% |
| Cree | 0.0 /100 | #322 | Tragic 10.8% |
| Dominicans | 0.0 /100 | #323 | Tragic 10.8% |
| Immigrants | Dominican Republic | 0.0 /100 | #324 | Tragic 10.8% |
| Cajuns | 0.0 /100 | #325 | Tragic 10.8% |
| Liberians | 0.0 /100 | #326 | Tragic 10.8% |
| Cape Verdeans | 0.0 /100 | #327 | Tragic 10.9% |
| Ottawa | 0.0 /100 | #328 | Tragic 10.9% |
| Pennsylvania Germans | 0.0 /100 | #329 | Tragic 11.0% |
| Chippewa | 0.0 /100 | #330 | Tragic 11.1% |
| Blacks/African Americans | 0.0 /100 | #331 | Tragic 11.4% |
Demographics Similar to Immigrants from Saudi Arabia by Unemployment Among Women with Children Ages 6 to 17 years
In terms of unemployment among women with children ages 6 to 17 years, the demographic groups most similar to Immigrants from Saudi Arabia are Arab (9.3%, a difference of 0.0%), Immigrants from Belize (9.3%, a difference of 0.080%), Hungarian (9.3%, a difference of 0.13%), Guatemalan (9.3%, a difference of 0.14%), and Uruguayan (9.3%, a difference of 0.15%).
| Demographics | Rating | Rank | Unemployment Among Women with Children Ages 6 to 17 years |
| French American Indians | 3.7 /100 | #232 | Tragic 9.3% |
| Immigrants | St. Vincent and the Grenadines | 3.3 /100 | #233 | Tragic 9.3% |
| Mexicans | 3.2 /100 | #234 | Tragic 9.3% |
| Uruguayans | 3.0 /100 | #235 | Tragic 9.3% |
| Hungarians | 3.0 /100 | #236 | Tragic 9.3% |
| Immigrants | Belize | 2.8 /100 | #237 | Tragic 9.3% |
| Arabs | 2.7 /100 | #238 | Tragic 9.3% |
| Immigrants | Saudi Arabia | 2.7 /100 | #239 | Tragic 9.3% |
| Guatemalans | 2.3 /100 | #240 | Tragic 9.3% |
| Colombians | 2.2 /100 | #241 | Tragic 9.3% |
| Immigrants | Colombia | 2.1 /100 | #242 | Tragic 9.3% |
| Scottish | 2.0 /100 | #243 | Tragic 9.4% |
| English | 1.9 /100 | #244 | Tragic 9.4% |
| Immigrants | Cameroon | 1.8 /100 | #245 | Tragic 9.4% |
| Immigrants | Africa | 1.6 /100 | #246 | Tragic 9.4% |