Immigrants from Eastern Africa vs Immigrants from Bolivia Unemployment Among Women with Children Under 18 years
COMPARE
Immigrants from Eastern Africa
Immigrants from Bolivia
Unemployment Among Women with Children Under 18 years
Unemployment Among Women with Children Under 18 years Comparison
Immigrants from Eastern Africa
Immigrants from Bolivia
5.4%
UNEMPLOYMENT AMONG WOMEN WITH CHILDREN UNDER 18 YEARS
51.3/ 100
METRIC RATING
173rd/ 347
METRIC RANK
5.1%
UNEMPLOYMENT AMONG WOMEN WITH CHILDREN UNDER 18 YEARS
96.1/ 100
METRIC RATING
72nd/ 347
METRIC RANK
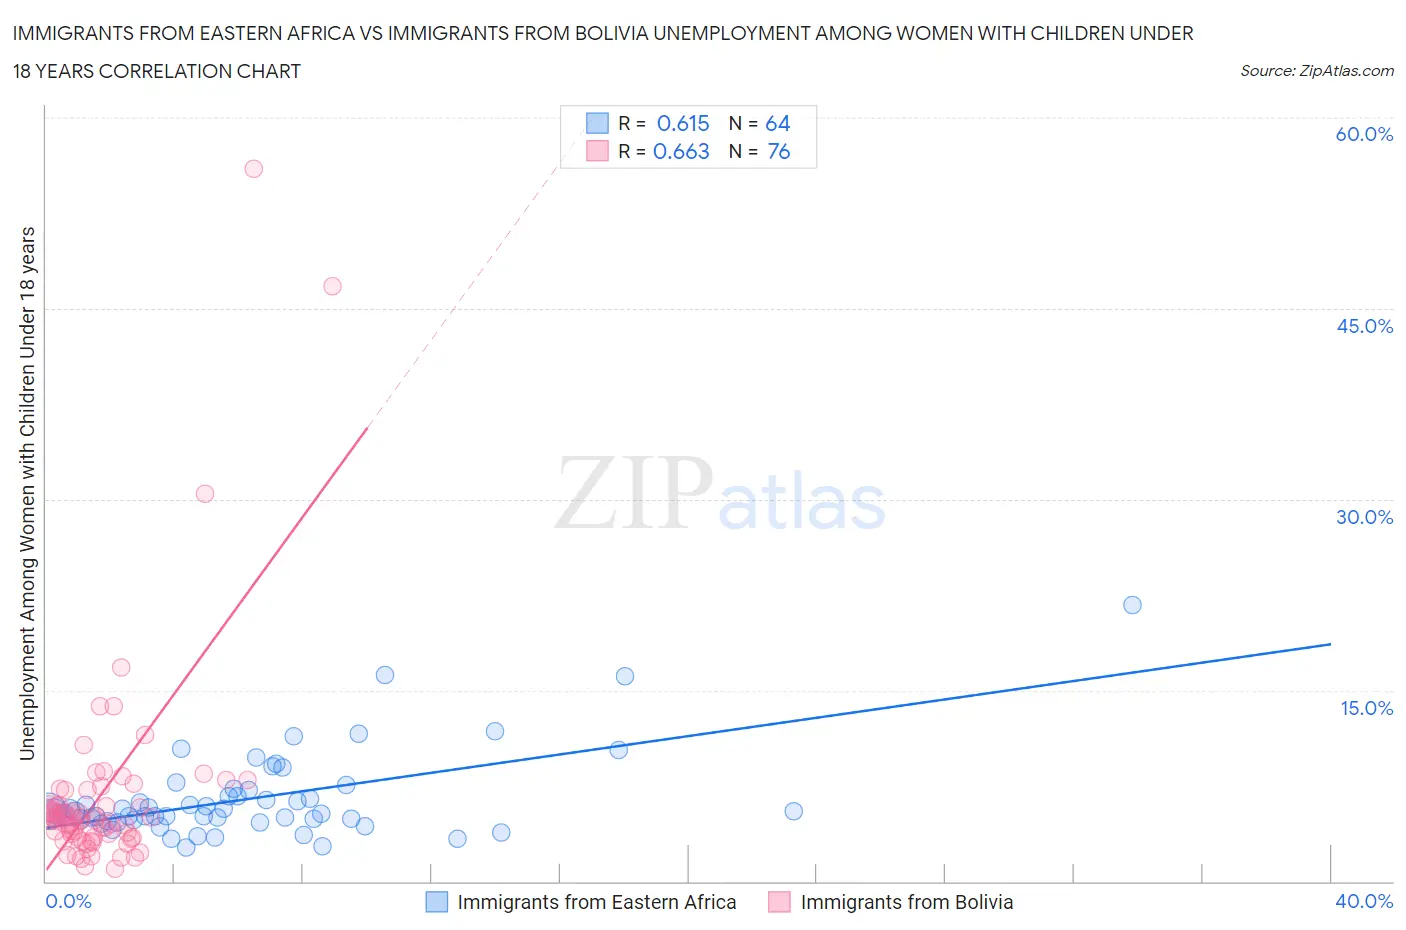
Immigrants from Eastern Africa vs Immigrants from Bolivia Unemployment Among Women with Children Under 18 years Correlation Chart
The statistical analysis conducted on geographies consisting of 345,026,115 people shows a significant positive correlation between the proportion of Immigrants from Eastern Africa and unemployment rate among women with children under the age of 18 in the United States with a correlation coefficient (R) of 0.615 and weighted average of 5.4%. Similarly, the statistical analysis conducted on geographies consisting of 156,676,474 people shows a significant positive correlation between the proportion of Immigrants from Bolivia and unemployment rate among women with children under the age of 18 in the United States with a correlation coefficient (R) of 0.663 and weighted average of 5.1%, a difference of 5.9%.
Unemployment Among Women with Children Under 18 years Correlation Summary
| Measurement | Immigrants from Eastern Africa | Immigrants from Bolivia |
| Minimum | 2.7% | 1.0% |
| Maximum | 21.7% | 56.0% |
| Range | 19.0% | 55.0% |
| Mean | 6.5% | 6.8% |
| Median | 5.5% | 5.0% |
| Interquartile 25% (IQ1) | 4.8% | 3.5% |
| Interquartile 75% (IQ3) | 6.9% | 6.6% |
| Interquartile Range (IQR) | 2.1% | 3.1% |
| Standard Deviation (Sample) | 3.4% | 8.4% |
| Standard Deviation (Population) | 3.3% | 8.4% |
Similar Demographics by Unemployment Among Women with Children Under 18 years
Demographics Similar to Immigrants from Eastern Africa by Unemployment Among Women with Children Under 18 years
In terms of unemployment among women with children under 18 years, the demographic groups most similar to Immigrants from Eastern Africa are Immigrants from Kazakhstan (5.4%, a difference of 0.030%), Immigrants from Uzbekistan (5.4%, a difference of 0.090%), Immigrants from Philippines (5.4%, a difference of 0.13%), Spanish (5.4%, a difference of 0.16%), and Samoan (5.4%, a difference of 0.20%).
| Demographics | Rating | Rank | Unemployment Among Women with Children Under 18 years |
| Aleuts | 59.4 /100 | #166 | Average 5.4% |
| Immigrants | Denmark | 58.0 /100 | #167 | Average 5.4% |
| Immigrants | Northern Africa | 56.1 /100 | #168 | Average 5.4% |
| Immigrants | Thailand | 55.3 /100 | #169 | Average 5.4% |
| Samoans | 54.1 /100 | #170 | Average 5.4% |
| Immigrants | Philippines | 53.1 /100 | #171 | Average 5.4% |
| Immigrants | Kazakhstan | 51.7 /100 | #172 | Average 5.4% |
| Immigrants | Eastern Africa | 51.3 /100 | #173 | Average 5.4% |
| Immigrants | Uzbekistan | 50.0 /100 | #174 | Average 5.4% |
| Spanish | 49.0 /100 | #175 | Average 5.4% |
| Immigrants | Germany | 48.5 /100 | #176 | Average 5.5% |
| Hawaiians | 46.1 /100 | #177 | Average 5.5% |
| Costa Ricans | 45.2 /100 | #178 | Average 5.5% |
| Syrians | 42.8 /100 | #179 | Average 5.5% |
| Immigrants | Southern Europe | 42.7 /100 | #180 | Average 5.5% |
Demographics Similar to Immigrants from Bolivia by Unemployment Among Women with Children Under 18 years
In terms of unemployment among women with children under 18 years, the demographic groups most similar to Immigrants from Bolivia are Albanian (5.1%, a difference of 0.070%), Immigrants from Northern Europe (5.1%, a difference of 0.080%), Immigrants from Asia (5.1%, a difference of 0.11%), Puget Sound Salish (5.1%, a difference of 0.14%), and Zimbabwean (5.1%, a difference of 0.16%).
| Demographics | Rating | Rank | Unemployment Among Women with Children Under 18 years |
| Immigrants | Sweden | 97.1 /100 | #65 | Exceptional 5.1% |
| Immigrants | Australia | 97.0 /100 | #66 | Exceptional 5.1% |
| Fijians | 96.9 /100 | #67 | Exceptional 5.1% |
| Irish | 96.8 /100 | #68 | Exceptional 5.1% |
| Austrians | 96.6 /100 | #69 | Exceptional 5.1% |
| Icelanders | 96.6 /100 | #70 | Exceptional 5.1% |
| Serbians | 96.5 /100 | #71 | Exceptional 5.1% |
| Immigrants | Bolivia | 96.1 /100 | #72 | Exceptional 5.1% |
| Albanians | 95.9 /100 | #73 | Exceptional 5.1% |
| Immigrants | Northern Europe | 95.9 /100 | #74 | Exceptional 5.1% |
| Immigrants | Asia | 95.8 /100 | #75 | Exceptional 5.1% |
| Puget Sound Salish | 95.8 /100 | #76 | Exceptional 5.1% |
| Zimbabweans | 95.7 /100 | #77 | Exceptional 5.1% |
| Assyrians/Chaldeans/Syriacs | 95.7 /100 | #78 | Exceptional 5.1% |
| Immigrants | Croatia | 95.6 /100 | #79 | Exceptional 5.1% |