Immigrants from El Salvador vs Immigrants from Poland Unemployment Among Women with Children Under 6 years
COMPARE
Immigrants from El Salvador
Immigrants from Poland
Unemployment Among Women with Children Under 6 years
Unemployment Among Women with Children Under 6 years Comparison
Immigrants from El Salvador
Immigrants from Poland
8.1%
UNEMPLOYMENT AMONG WOMEN WITH CHILDREN UNDER 6 YEARS
2.6/ 100
METRIC RATING
240th/ 347
METRIC RANK
7.8%
UNEMPLOYMENT AMONG WOMEN WITH CHILDREN UNDER 6 YEARS
27.3/ 100
METRIC RATING
199th/ 347
METRIC RANK
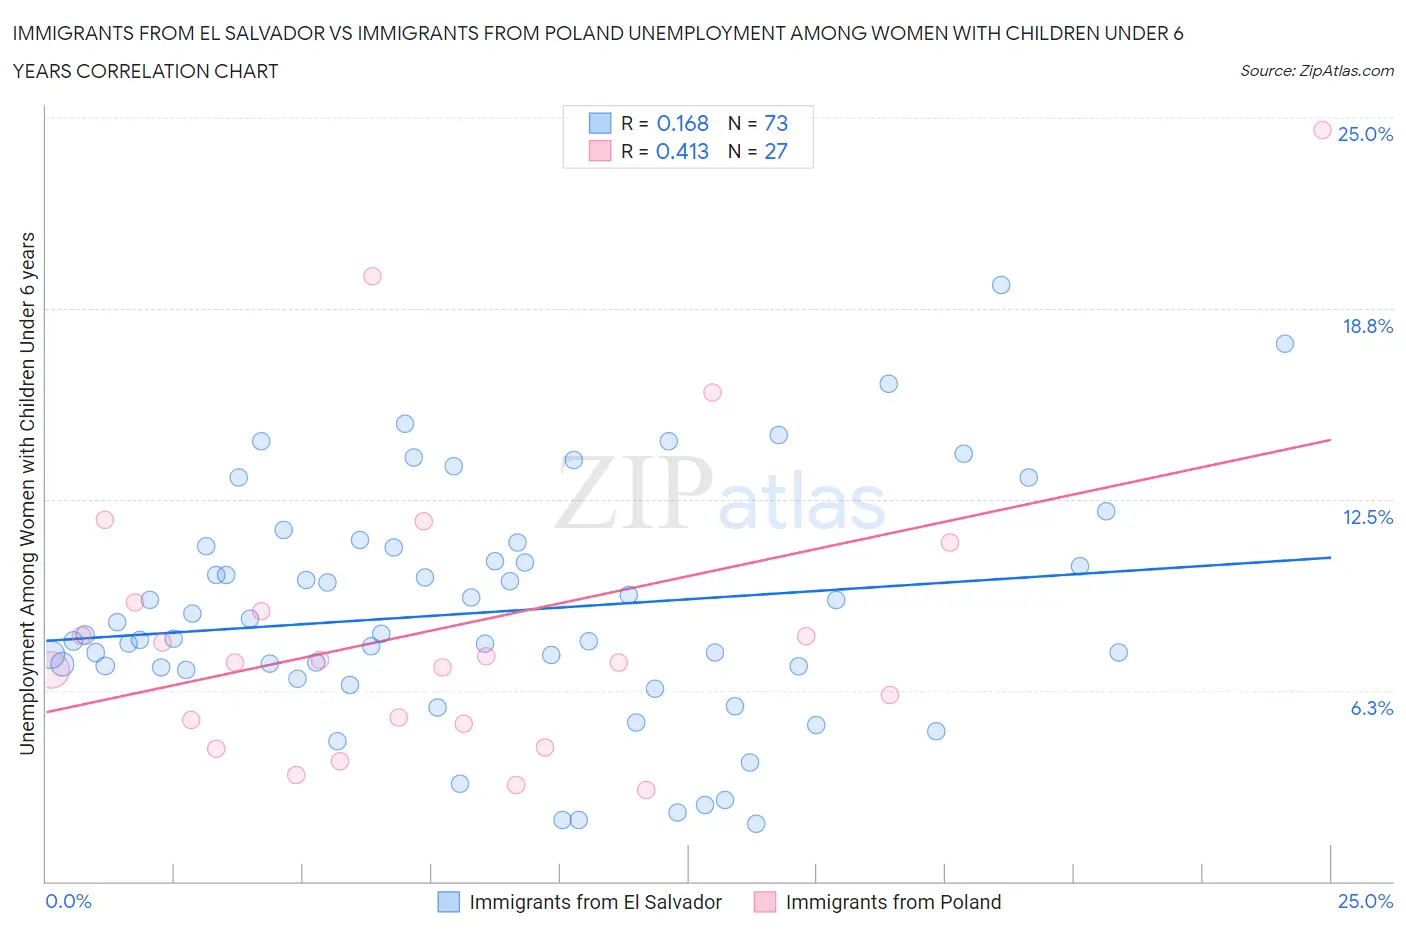
Immigrants from El Salvador vs Immigrants from Poland Unemployment Among Women with Children Under 6 years Correlation Chart
The statistical analysis conducted on geographies consisting of 286,042,904 people shows a poor positive correlation between the proportion of Immigrants from El Salvador and unemployment rate among women with children under the age of 6 in the United States with a correlation coefficient (R) of 0.168 and weighted average of 8.1%. Similarly, the statistical analysis conducted on geographies consisting of 238,421,278 people shows a moderate positive correlation between the proportion of Immigrants from Poland and unemployment rate among women with children under the age of 6 in the United States with a correlation coefficient (R) of 0.413 and weighted average of 7.8%, a difference of 4.3%.
Unemployment Among Women with Children Under 6 years Correlation Summary
| Measurement | Immigrants from El Salvador | Immigrants from Poland |
| Minimum | 1.9% | 3.0% |
| Maximum | 19.5% | 24.6% |
| Range | 17.6% | 21.6% |
| Mean | 8.8% | 8.3% |
| Median | 8.1% | 7.2% |
| Interquartile 25% (IQ1) | 7.0% | 5.1% |
| Interquartile 75% (IQ3) | 10.9% | 9.1% |
| Interquartile Range (IQR) | 4.0% | 4.0% |
| Standard Deviation (Sample) | 3.8% | 5.0% |
| Standard Deviation (Population) | 3.7% | 4.9% |
Similar Demographics by Unemployment Among Women with Children Under 6 years
Demographics Similar to Immigrants from El Salvador by Unemployment Among Women with Children Under 6 years
In terms of unemployment among women with children under 6 years, the demographic groups most similar to Immigrants from El Salvador are Liberian (8.1%, a difference of 0.030%), Irish (8.1%, a difference of 0.070%), Dutch (8.1%, a difference of 0.080%), Immigrants from Middle Africa (8.1%, a difference of 0.34%), and Hawaiian (8.2%, a difference of 0.64%).
| Demographics | Rating | Rank | Unemployment Among Women with Children Under 6 years |
| Immigrants | Trinidad and Tobago | 4.8 /100 | #233 | Tragic 8.0% |
| Kiowa | 4.4 /100 | #234 | Tragic 8.0% |
| Comanche | 4.3 /100 | #235 | Tragic 8.0% |
| Immigrants | Barbados | 4.2 /100 | #236 | Tragic 8.0% |
| Immigrants | Costa Rica | 4.1 /100 | #237 | Tragic 8.0% |
| Immigrants | Middle Africa | 3.2 /100 | #238 | Tragic 8.1% |
| Irish | 2.7 /100 | #239 | Tragic 8.1% |
| Immigrants | El Salvador | 2.6 /100 | #240 | Tragic 8.1% |
| Liberians | 2.6 /100 | #241 | Tragic 8.1% |
| Dutch | 2.5 /100 | #242 | Tragic 8.1% |
| Hawaiians | 1.8 /100 | #243 | Tragic 8.2% |
| French | 1.7 /100 | #244 | Tragic 8.2% |
| Native Hawaiians | 1.7 /100 | #245 | Tragic 8.2% |
| Central Americans | 1.4 /100 | #246 | Tragic 8.2% |
| German Russians | 1.2 /100 | #247 | Tragic 8.2% |
Demographics Similar to Immigrants from Poland by Unemployment Among Women with Children Under 6 years
In terms of unemployment among women with children under 6 years, the demographic groups most similar to Immigrants from Poland are Guamanian/Chamorro (7.8%, a difference of 0.15%), Lithuanian (7.8%, a difference of 0.21%), Basque (7.8%, a difference of 0.22%), Italian (7.7%, a difference of 0.25%), and Malaysian (7.7%, a difference of 0.30%).
| Demographics | Rating | Rank | Unemployment Among Women with Children Under 6 years |
| Immigrants | Africa | 32.4 /100 | #192 | Fair 7.7% |
| Slavs | 32.4 /100 | #193 | Fair 7.7% |
| Syrians | 31.9 /100 | #194 | Fair 7.7% |
| Malaysians | 31.1 /100 | #195 | Fair 7.7% |
| Immigrants | St. Vincent and the Grenadines | 31.1 /100 | #196 | Fair 7.7% |
| Italians | 30.4 /100 | #197 | Fair 7.7% |
| Lithuanians | 30.0 /100 | #198 | Fair 7.8% |
| Immigrants | Poland | 27.3 /100 | #199 | Fair 7.8% |
| Guamanians/Chamorros | 25.5 /100 | #200 | Fair 7.8% |
| Basques | 24.7 /100 | #201 | Fair 7.8% |
| Sudanese | 23.5 /100 | #202 | Fair 7.8% |
| Spaniards | 23.3 /100 | #203 | Fair 7.8% |
| Lebanese | 22.2 /100 | #204 | Fair 7.8% |
| Immigrants | Immigrants | 21.4 /100 | #205 | Fair 7.8% |
| Hungarians | 21.2 /100 | #206 | Fair 7.8% |