Immigrants from Ethiopia vs Scottish Female Unemployment
COMPARE
Immigrants from Ethiopia
Scottish
Female Unemployment
Female Unemployment Comparison
Immigrants from Ethiopia
Scottish
5.1%
FEMALE UNEMPLOYMENT
85.4/ 100
METRIC RATING
131st/ 347
METRIC RANK
4.7%
FEMALE UNEMPLOYMENT
99.9/ 100
METRIC RATING
23rd/ 347
METRIC RANK
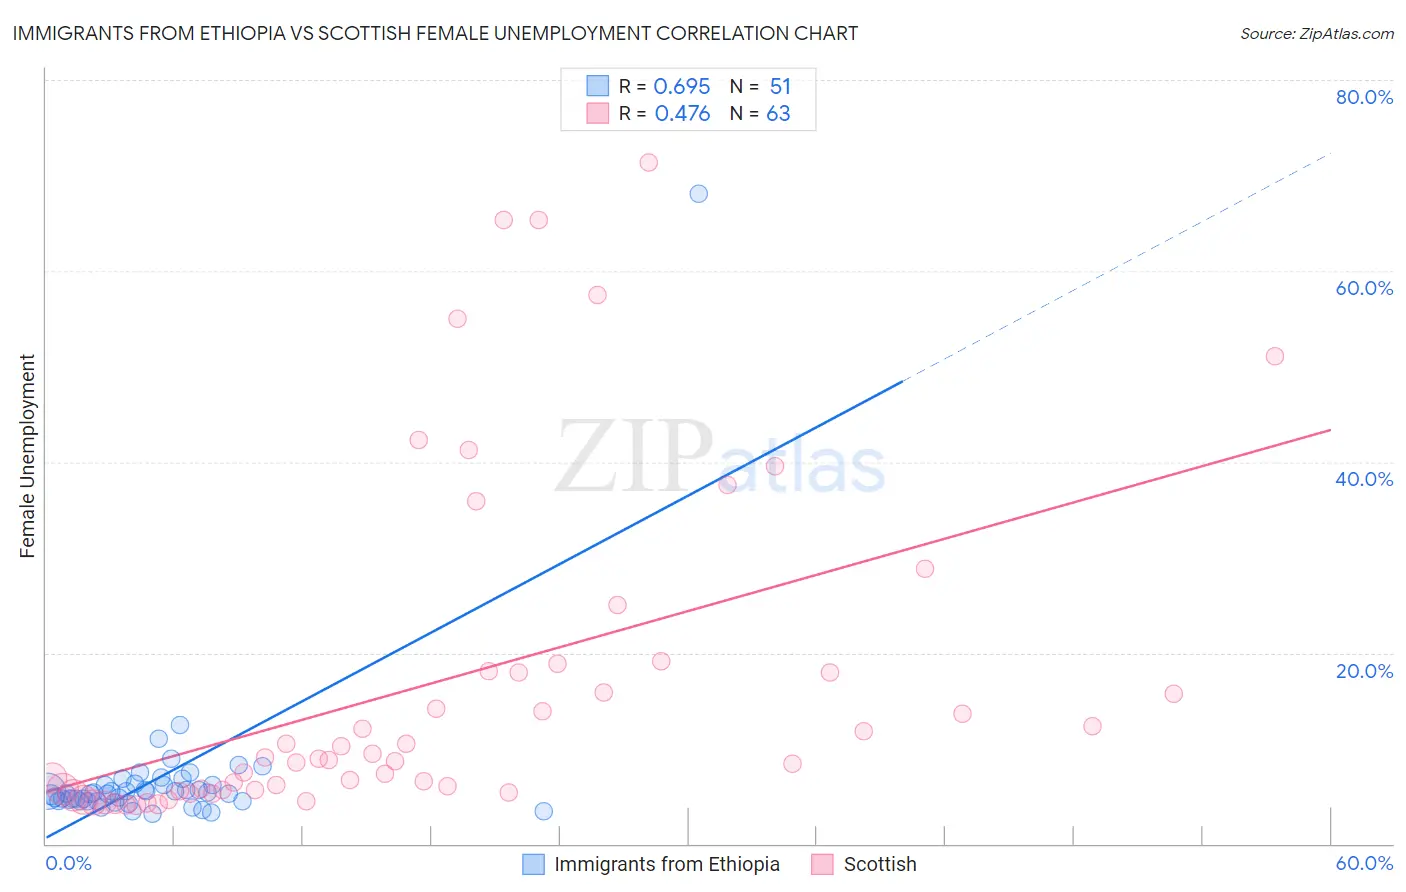
Immigrants from Ethiopia vs Scottish Female Unemployment Correlation Chart
The statistical analysis conducted on geographies consisting of 211,284,920 people shows a significant positive correlation between the proportion of Immigrants from Ethiopia and unemploymnet rate among females in the United States with a correlation coefficient (R) of 0.695 and weighted average of 5.1%. Similarly, the statistical analysis conducted on geographies consisting of 553,178,597 people shows a moderate positive correlation between the proportion of Scottish and unemploymnet rate among females in the United States with a correlation coefficient (R) of 0.476 and weighted average of 4.7%, a difference of 8.6%.
Female Unemployment Correlation Summary
| Measurement | Immigrants from Ethiopia | Scottish |
| Minimum | 3.1% | 4.1% |
| Maximum | 68.1% | 71.4% |
| Range | 65.0% | 67.3% |
| Mean | 6.8% | 16.8% |
| Median | 5.3% | 8.9% |
| Interquartile 25% (IQ1) | 4.5% | 5.6% |
| Interquartile 75% (IQ3) | 6.2% | 18.0% |
| Interquartile Range (IQR) | 1.7% | 12.5% |
| Standard Deviation (Sample) | 8.9% | 17.5% |
| Standard Deviation (Population) | 8.8% | 17.4% |
Similar Demographics by Female Unemployment
Demographics Similar to Immigrants from Ethiopia by Female Unemployment
In terms of female unemployment, the demographic groups most similar to Immigrants from Ethiopia are Maltese (5.1%, a difference of 0.020%), Ethiopian (5.1%, a difference of 0.050%), Immigrants from Sri Lanka (5.1%, a difference of 0.050%), Chilean (5.1%, a difference of 0.060%), and Immigrants from Hong Kong (5.1%, a difference of 0.070%).
| Demographics | Rating | Rank | Female Unemployment |
| Immigrants | Europe | 87.2 /100 | #124 | Excellent 5.1% |
| Basques | 86.5 /100 | #125 | Excellent 5.1% |
| Immigrants | Korea | 86.3 /100 | #126 | Excellent 5.1% |
| Immigrants | Hungary | 86.0 /100 | #127 | Excellent 5.1% |
| Chileans | 85.8 /100 | #128 | Excellent 5.1% |
| Ethiopians | 85.7 /100 | #129 | Excellent 5.1% |
| Maltese | 85.5 /100 | #130 | Excellent 5.1% |
| Immigrants | Ethiopia | 85.4 /100 | #131 | Excellent 5.1% |
| Immigrants | Sri Lanka | 85.0 /100 | #132 | Excellent 5.1% |
| Immigrants | Hong Kong | 84.8 /100 | #133 | Excellent 5.1% |
| Immigrants | Eritrea | 84.6 /100 | #134 | Excellent 5.1% |
| Immigrants | Latvia | 84.6 /100 | #135 | Excellent 5.1% |
| Indians (Asian) | 84.2 /100 | #136 | Excellent 5.1% |
| Pakistanis | 83.8 /100 | #137 | Excellent 5.1% |
| Chickasaw | 83.2 /100 | #138 | Excellent 5.1% |
Demographics Similar to Scottish by Female Unemployment
In terms of female unemployment, the demographic groups most similar to Scottish are Welsh (4.7%, a difference of 0.21%), Immigrants from India (4.7%, a difference of 0.29%), Immigrants from Bosnia and Herzegovina (4.7%, a difference of 0.33%), British (4.7%, a difference of 0.50%), and Irish (4.7%, a difference of 0.53%).
| Demographics | Rating | Rank | Female Unemployment |
| Carpatho Rusyns | 99.9 /100 | #16 | Exceptional 4.7% |
| Croatians | 99.9 /100 | #17 | Exceptional 4.7% |
| Latvians | 99.9 /100 | #18 | Exceptional 4.7% |
| Poles | 99.9 /100 | #19 | Exceptional 4.7% |
| Bulgarians | 99.9 /100 | #20 | Exceptional 4.7% |
| Fijians | 99.9 /100 | #21 | Exceptional 4.7% |
| Europeans | 99.9 /100 | #22 | Exceptional 4.7% |
| Scottish | 99.9 /100 | #23 | Exceptional 4.7% |
| Welsh | 99.9 /100 | #24 | Exceptional 4.7% |
| Immigrants | India | 99.9 /100 | #25 | Exceptional 4.7% |
| Immigrants | Bosnia and Herzegovina | 99.9 /100 | #26 | Exceptional 4.7% |
| British | 99.9 /100 | #27 | Exceptional 4.7% |
| Irish | 99.9 /100 | #28 | Exceptional 4.7% |
| Cypriots | 99.9 /100 | #29 | Exceptional 4.7% |
| Lithuanians | 99.8 /100 | #30 | Exceptional 4.7% |