Immigrants from Europe vs Immigrants from Romania Unemployment Among Ages 20 to 24 years
COMPARE
Immigrants from Europe
Immigrants from Romania
Unemployment Among Ages 20 to 24 years
Unemployment Among Ages 20 to 24 years Comparison
Immigrants from Europe
Immigrants from Romania
10.4%
UNEMPLOYMENT AMONG AGES 20 TO 24 YEARS
18.5/ 100
METRIC RATING
206th/ 347
METRIC RANK
10.2%
UNEMPLOYMENT AMONG AGES 20 TO 24 YEARS
75.7/ 100
METRIC RATING
148th/ 347
METRIC RANK
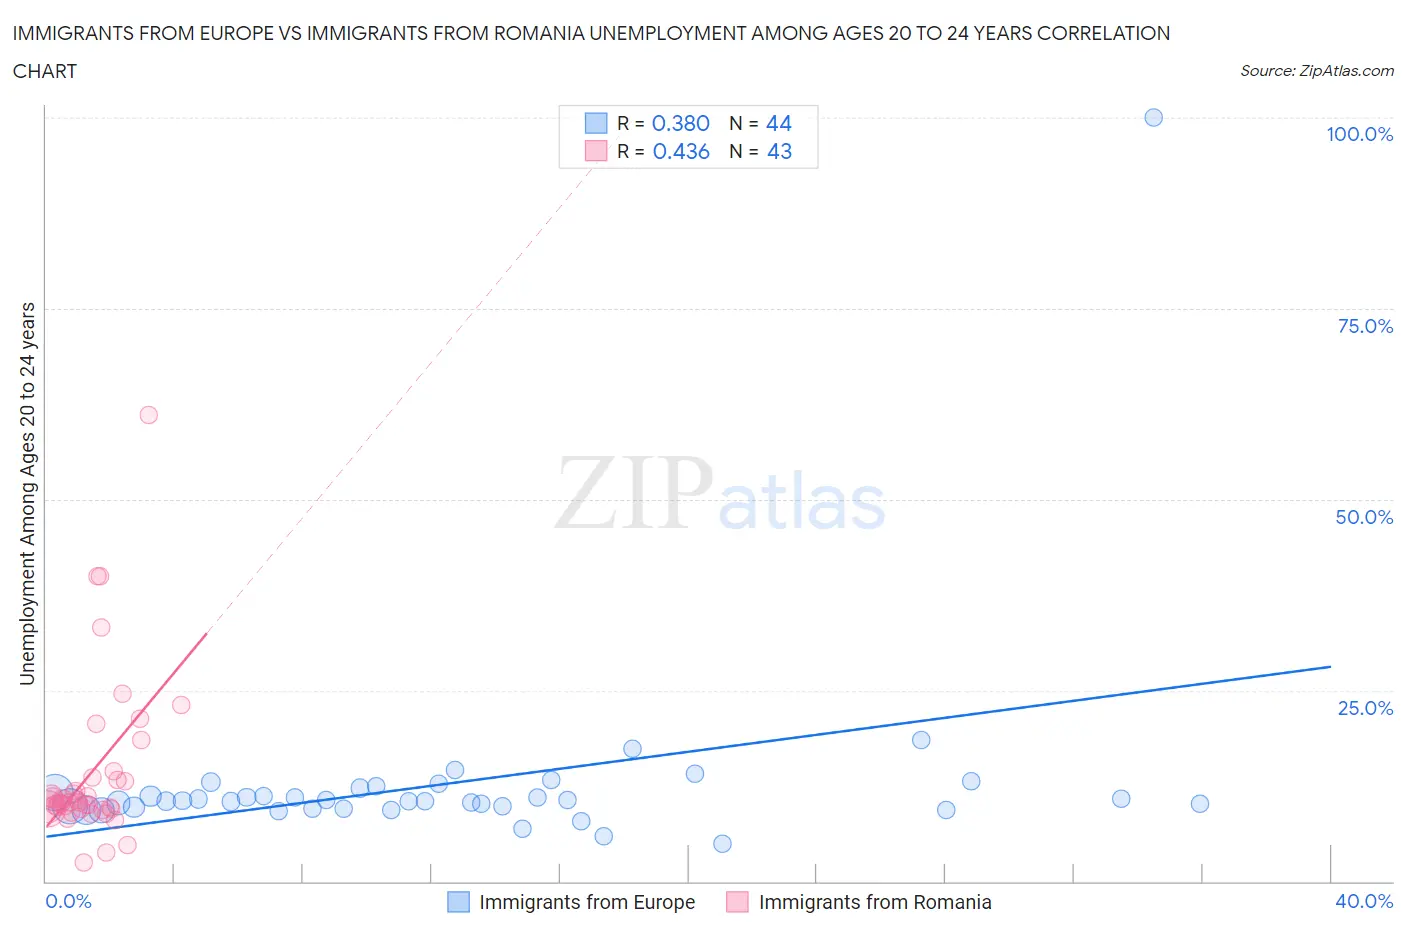
Immigrants from Europe vs Immigrants from Romania Unemployment Among Ages 20 to 24 years Correlation Chart
The statistical analysis conducted on geographies consisting of 510,398,062 people shows a mild positive correlation between the proportion of Immigrants from Europe and unemployment rate among population between the ages 20 and 24 in the United States with a correlation coefficient (R) of 0.380 and weighted average of 10.4%. Similarly, the statistical analysis conducted on geographies consisting of 252,732,931 people shows a moderate positive correlation between the proportion of Immigrants from Romania and unemployment rate among population between the ages 20 and 24 in the United States with a correlation coefficient (R) of 0.436 and weighted average of 10.2%, a difference of 2.4%.
Unemployment Among Ages 20 to 24 years Correlation Summary
| Measurement | Immigrants from Europe | Immigrants from Romania |
| Minimum | 4.9% | 2.4% |
| Maximum | 100.0% | 61.1% |
| Range | 95.1% | 58.7% |
| Mean | 12.8% | 14.3% |
| Median | 10.5% | 10.3% |
| Interquartile 25% (IQ1) | 9.6% | 9.4% |
| Interquartile 75% (IQ3) | 11.9% | 13.6% |
| Interquartile Range (IQR) | 2.2% | 4.2% |
| Standard Deviation (Sample) | 13.7% | 11.0% |
| Standard Deviation (Population) | 13.5% | 10.8% |
Similar Demographics by Unemployment Among Ages 20 to 24 years
Demographics Similar to Immigrants from Europe by Unemployment Among Ages 20 to 24 years
In terms of unemployment among ages 20 to 24 years, the demographic groups most similar to Immigrants from Europe are Cypriot (10.4%, a difference of 0.030%), Immigrants from Honduras (10.4%, a difference of 0.030%), Immigrants from Northern Europe (10.4%, a difference of 0.060%), Immigrants from Hong Kong (10.5%, a difference of 0.060%), and Peruvian (10.5%, a difference of 0.080%).
| Demographics | Rating | Rank | Unemployment Among Ages 20 to 24 years |
| Portuguese | 21.8 /100 | #199 | Fair 10.4% |
| Russians | 21.2 /100 | #200 | Fair 10.4% |
| Immigrants | Peru | 21.2 /100 | #201 | Fair 10.4% |
| Immigrants | Middle Africa | 20.9 /100 | #202 | Fair 10.4% |
| South Americans | 20.6 /100 | #203 | Fair 10.4% |
| Immigrants | Northern Europe | 19.5 /100 | #204 | Poor 10.4% |
| Cypriots | 18.9 /100 | #205 | Poor 10.4% |
| Immigrants | Europe | 18.5 /100 | #206 | Poor 10.4% |
| Immigrants | Honduras | 17.9 /100 | #207 | Poor 10.4% |
| Immigrants | Hong Kong | 17.6 /100 | #208 | Poor 10.5% |
| Peruvians | 17.2 /100 | #209 | Poor 10.5% |
| Immigrants | Belgium | 16.9 /100 | #210 | Poor 10.5% |
| Immigrants | Guatemala | 14.6 /100 | #211 | Poor 10.5% |
| Immigrants | Sri Lanka | 14.0 /100 | #212 | Poor 10.5% |
| Guatemalans | 12.2 /100 | #213 | Poor 10.5% |
Demographics Similar to Immigrants from Romania by Unemployment Among Ages 20 to 24 years
In terms of unemployment among ages 20 to 24 years, the demographic groups most similar to Immigrants from Romania are Immigrants from Scotland (10.2%, a difference of 0.060%), Hungarian (10.2%, a difference of 0.060%), French Canadian (10.2%, a difference of 0.090%), Asian (10.2%, a difference of 0.10%), and Immigrants from South Africa (10.2%, a difference of 0.10%).
| Demographics | Rating | Rank | Unemployment Among Ages 20 to 24 years |
| Immigrants | Azores | 81.4 /100 | #141 | Excellent 10.2% |
| Slovaks | 80.2 /100 | #142 | Excellent 10.2% |
| Immigrants | Jordan | 79.0 /100 | #143 | Good 10.2% |
| Brazilians | 78.4 /100 | #144 | Good 10.2% |
| Argentineans | 78.0 /100 | #145 | Good 10.2% |
| Asians | 77.7 /100 | #146 | Good 10.2% |
| French Canadians | 77.5 /100 | #147 | Good 10.2% |
| Immigrants | Romania | 75.7 /100 | #148 | Good 10.2% |
| Immigrants | Scotland | 74.6 /100 | #149 | Good 10.2% |
| Hungarians | 74.4 /100 | #150 | Good 10.2% |
| Immigrants | South Africa | 73.6 /100 | #151 | Good 10.2% |
| Iranians | 72.4 /100 | #152 | Good 10.2% |
| Immigrants | Taiwan | 71.4 /100 | #153 | Good 10.2% |
| Immigrants | Switzerland | 71.3 /100 | #154 | Good 10.2% |
| Lithuanians | 70.0 /100 | #155 | Good 10.2% |