Immigrants from Ghana vs Egyptian Male Unemployment
COMPARE
Immigrants from Ghana
Egyptian
Male Unemployment
Male Unemployment Comparison
Immigrants from Ghana
Egyptians
6.2%
MALE UNEMPLOYMENT
0.0/ 100
METRIC RATING
280th/ 347
METRIC RANK
5.2%
MALE UNEMPLOYMENT
74.8/ 100
METRIC RATING
152nd/ 347
METRIC RANK
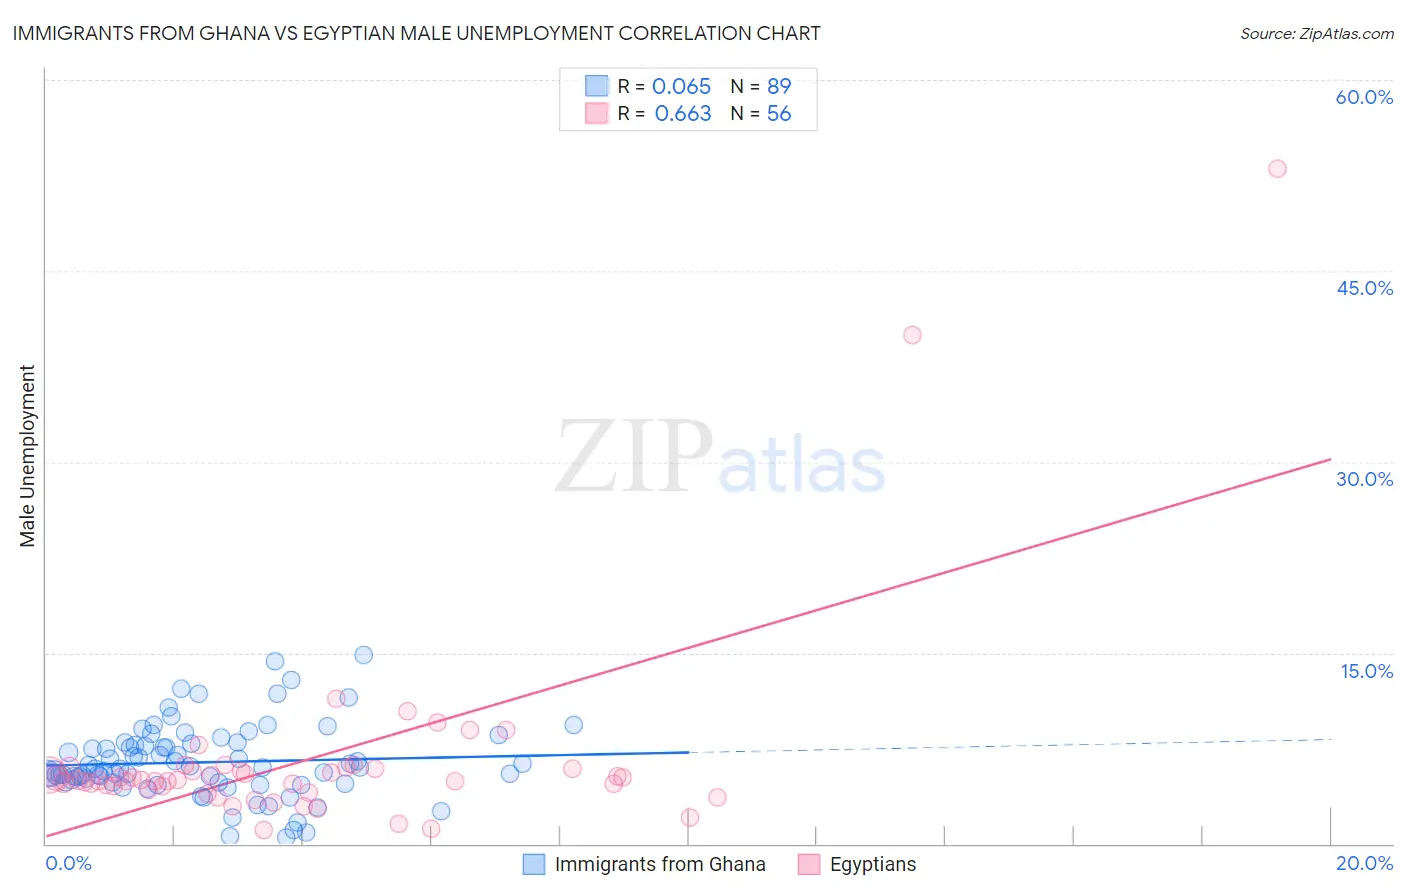
Immigrants from Ghana vs Egyptian Male Unemployment Correlation Chart
The statistical analysis conducted on geographies consisting of 199,472,146 people shows a slight positive correlation between the proportion of Immigrants from Ghana and unemployment rate among males in the United States with a correlation coefficient (R) of 0.065 and weighted average of 6.2%. Similarly, the statistical analysis conducted on geographies consisting of 276,492,252 people shows a significant positive correlation between the proportion of Egyptians and unemployment rate among males in the United States with a correlation coefficient (R) of 0.663 and weighted average of 5.2%, a difference of 18.1%.
Male Unemployment Correlation Summary
| Measurement | Immigrants from Ghana | Egyptian |
| Minimum | 0.50% | 1.1% |
| Maximum | 14.8% | 53.0% |
| Range | 14.3% | 51.9% |
| Mean | 6.4% | 6.6% |
| Median | 5.9% | 5.0% |
| Interquartile 25% (IQ1) | 4.9% | 4.4% |
| Interquartile 75% (IQ3) | 7.8% | 5.9% |
| Interquartile Range (IQR) | 3.0% | 1.5% |
| Standard Deviation (Sample) | 2.8% | 8.1% |
| Standard Deviation (Population) | 2.8% | 8.0% |
Similar Demographics by Male Unemployment
Demographics Similar to Immigrants from Ghana by Male Unemployment
In terms of male unemployment, the demographic groups most similar to Immigrants from Ghana are Sierra Leonean (6.2%, a difference of 0.070%), Ecuadorian (6.2%, a difference of 0.50%), Immigrants from Western Africa (6.2%, a difference of 0.53%), Ghanaian (6.1%, a difference of 0.99%), and Spanish American Indian (6.2%, a difference of 1.2%).
| Demographics | Rating | Rank | Male Unemployment |
| Armenians | 0.0 /100 | #273 | Tragic 6.0% |
| Immigrants | Sierra Leone | 0.0 /100 | #274 | Tragic 6.0% |
| Menominee | 0.0 /100 | #275 | Tragic 6.0% |
| Tlingit-Haida | 0.0 /100 | #276 | Tragic 6.0% |
| Immigrants | Liberia | 0.0 /100 | #277 | Tragic 6.1% |
| Immigrants | Fiji | 0.0 /100 | #278 | Tragic 6.1% |
| Ghanaians | 0.0 /100 | #279 | Tragic 6.1% |
| Immigrants | Ghana | 0.0 /100 | #280 | Tragic 6.2% |
| Sierra Leoneans | 0.0 /100 | #281 | Tragic 6.2% |
| Ecuadorians | 0.0 /100 | #282 | Tragic 6.2% |
| Immigrants | Western Africa | 0.0 /100 | #283 | Tragic 6.2% |
| Spanish American Indians | 0.0 /100 | #284 | Tragic 6.2% |
| Immigrants | Ecuador | 0.0 /100 | #285 | Tragic 6.2% |
| Africans | 0.0 /100 | #286 | Tragic 6.3% |
| Central American Indians | 0.0 /100 | #287 | Tragic 6.3% |
Demographics Similar to Egyptians by Male Unemployment
In terms of male unemployment, the demographic groups most similar to Egyptians are Slovak (5.2%, a difference of 0.050%), Immigrants from Uruguay (5.2%, a difference of 0.070%), Laotian (5.2%, a difference of 0.080%), Indian (Asian) (5.2%, a difference of 0.090%), and Immigrants from Europe (5.2%, a difference of 0.11%).
| Demographics | Rating | Rank | Male Unemployment |
| Macedonians | 77.7 /100 | #145 | Good 5.2% |
| Immigrants | Kenya | 77.6 /100 | #146 | Good 5.2% |
| Immigrants | Burma/Myanmar | 77.5 /100 | #147 | Good 5.2% |
| Immigrants | Italy | 76.3 /100 | #148 | Good 5.2% |
| Immigrants | Europe | 76.2 /100 | #149 | Good 5.2% |
| Indians (Asian) | 76.0 /100 | #150 | Good 5.2% |
| Slovaks | 75.5 /100 | #151 | Good 5.2% |
| Egyptians | 74.8 /100 | #152 | Good 5.2% |
| Immigrants | Uruguay | 73.9 /100 | #153 | Good 5.2% |
| Laotians | 73.8 /100 | #154 | Good 5.2% |
| Immigrants | Hungary | 73.4 /100 | #155 | Good 5.2% |
| Americans | 72.7 /100 | #156 | Good 5.2% |
| Immigrants | Northern Africa | 72.3 /100 | #157 | Good 5.2% |
| Immigrants | Indonesia | 71.5 /100 | #158 | Good 5.2% |
| Indonesians | 71.2 /100 | #159 | Good 5.2% |