Immigrants from Hungary vs Paiute Unemployment Among Seniors over 65 years
COMPARE
Immigrants from Hungary
Paiute
Unemployment Among Seniors over 65 years
Unemployment Among Seniors over 65 years Comparison
Immigrants from Hungary
Paiute
5.0%
UNEMPLOYMENT AMONG SENIORS OVER 65 YEARS
98.2/ 100
METRIC RATING
85th/ 347
METRIC RANK
6.3%
UNEMPLOYMENT AMONG SENIORS OVER 65 YEARS
0.0/ 100
METRIC RATING
339th/ 347
METRIC RANK
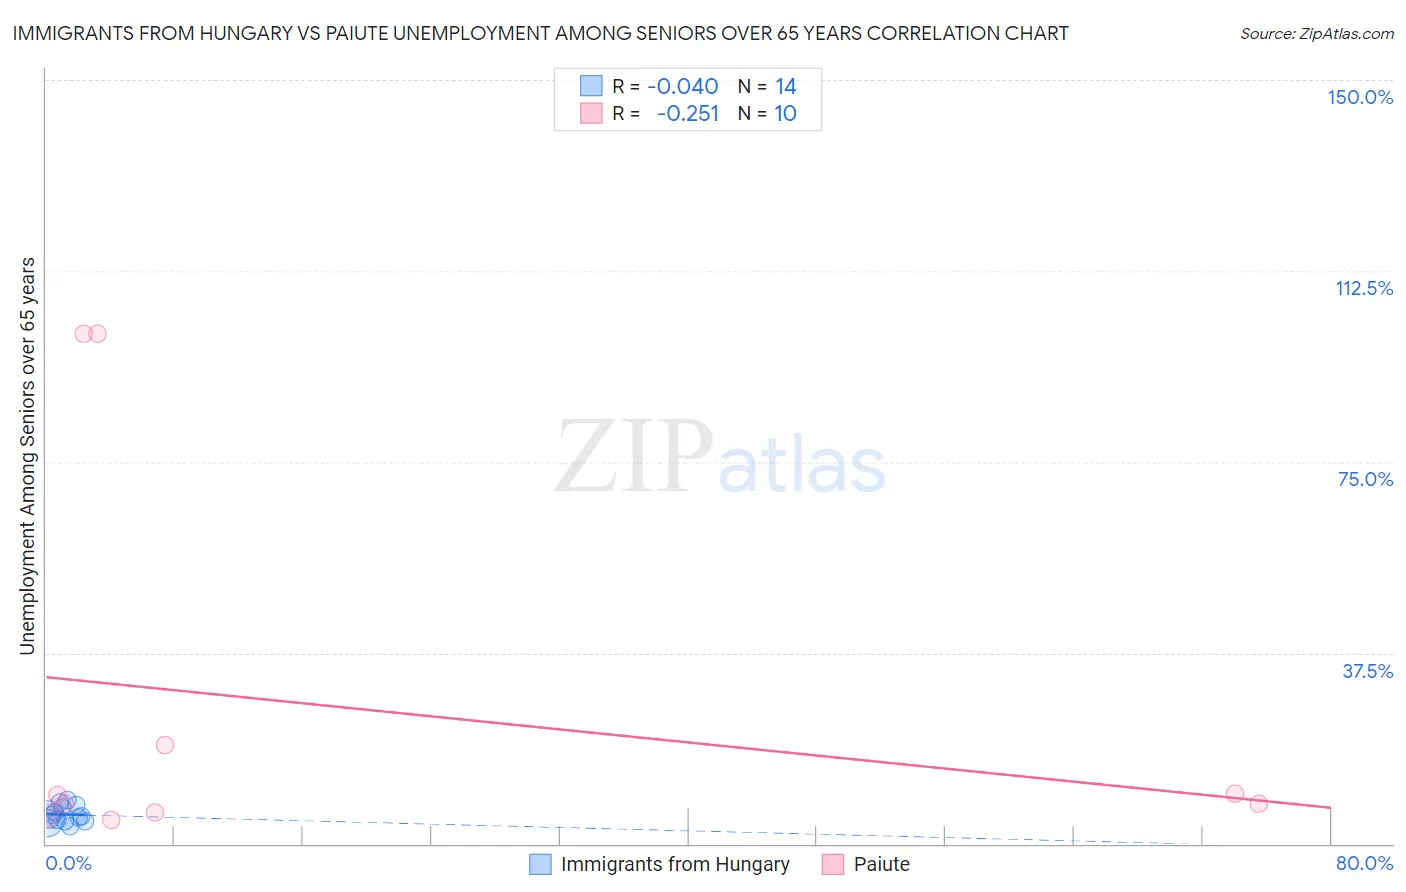
Immigrants from Hungary vs Paiute Unemployment Among Seniors over 65 years Correlation Chart
The statistical analysis conducted on geographies consisting of 187,100,092 people shows no correlation between the proportion of Immigrants from Hungary and unemployment rate amomg seniors over the age of 65 in the United States with a correlation coefficient (R) of -0.040 and weighted average of 5.0%. Similarly, the statistical analysis conducted on geographies consisting of 56,841,036 people shows a weak negative correlation between the proportion of Paiute and unemployment rate amomg seniors over the age of 65 in the United States with a correlation coefficient (R) of -0.251 and weighted average of 6.3%, a difference of 27.0%.
Unemployment Among Seniors over 65 years Correlation Summary
| Measurement | Immigrants from Hungary | Paiute |
| Minimum | 3.3% | 4.8% |
| Maximum | 8.5% | 100.1% |
| Range | 5.2% | 95.3% |
| Mean | 5.7% | 27.1% |
| Median | 5.3% | 8.7% |
| Interquartile 25% (IQ1) | 4.7% | 6.1% |
| Interquartile 75% (IQ3) | 7.1% | 19.3% |
| Interquartile Range (IQR) | 2.3% | 13.2% |
| Standard Deviation (Sample) | 1.5% | 38.7% |
| Standard Deviation (Population) | 1.5% | 36.7% |
Similar Demographics by Unemployment Among Seniors over 65 years
Demographics Similar to Immigrants from Hungary by Unemployment Among Seniors over 65 years
In terms of unemployment among seniors over 65 years, the demographic groups most similar to Immigrants from Hungary are Immigrants from Taiwan (5.0%, a difference of 0.0%), Immigrants from Switzerland (5.0%, a difference of 0.010%), Filipino (5.0%, a difference of 0.060%), Immigrants from Zimbabwe (5.0%, a difference of 0.070%), and Serbian (5.0%, a difference of 0.10%).
| Demographics | Rating | Rank | Unemployment Among Seniors over 65 years |
| Slavs | 98.9 /100 | #78 | Exceptional 5.0% |
| Immigrants | Netherlands | 98.8 /100 | #79 | Exceptional 5.0% |
| Immigrants | Ethiopia | 98.6 /100 | #80 | Exceptional 5.0% |
| Estonians | 98.5 /100 | #81 | Exceptional 5.0% |
| Serbians | 98.4 /100 | #82 | Exceptional 5.0% |
| Immigrants | Zimbabwe | 98.3 /100 | #83 | Exceptional 5.0% |
| Filipinos | 98.3 /100 | #84 | Exceptional 5.0% |
| Immigrants | Hungary | 98.2 /100 | #85 | Exceptional 5.0% |
| Immigrants | Taiwan | 98.2 /100 | #86 | Exceptional 5.0% |
| Immigrants | Switzerland | 98.2 /100 | #87 | Exceptional 5.0% |
| Afghans | 97.6 /100 | #88 | Exceptional 5.0% |
| Immigrants | South Central Asia | 97.6 /100 | #89 | Exceptional 5.0% |
| Immigrants | South Africa | 97.6 /100 | #90 | Exceptional 5.0% |
| Immigrants | Bolivia | 97.3 /100 | #91 | Exceptional 5.0% |
| Immigrants | Bulgaria | 97.3 /100 | #92 | Exceptional 5.0% |
Demographics Similar to Paiute by Unemployment Among Seniors over 65 years
In terms of unemployment among seniors over 65 years, the demographic groups most similar to Paiute are Ute (6.3%, a difference of 0.060%), Immigrants from the Azores (6.3%, a difference of 0.27%), Alaska Native (6.3%, a difference of 0.44%), Pima (6.3%, a difference of 0.99%), and Immigrants from Armenia (6.2%, a difference of 2.8%).
| Demographics | Rating | Rank | Unemployment Among Seniors over 65 years |
| Aleuts | 0.0 /100 | #332 | Tragic 6.0% |
| Immigrants | Dominican Republic | 0.0 /100 | #333 | Tragic 6.0% |
| Tohono O'odham | 0.0 /100 | #334 | Tragic 6.1% |
| Immigrants | Armenia | 0.0 /100 | #335 | Tragic 6.2% |
| Pima | 0.0 /100 | #336 | Tragic 6.3% |
| Alaska Natives | 0.0 /100 | #337 | Tragic 6.3% |
| Immigrants | Azores | 0.0 /100 | #338 | Tragic 6.3% |
| Paiute | 0.0 /100 | #339 | Tragic 6.3% |
| Ute | 0.0 /100 | #340 | Tragic 6.3% |
| Yakama | 0.0 /100 | #341 | Tragic 6.7% |
| Navajo | 0.0 /100 | #342 | Tragic 6.7% |
| Tlingit-Haida | 0.0 /100 | #343 | Tragic 6.8% |
| Alaskan Athabascans | 0.0 /100 | #344 | Tragic 7.0% |
| Immigrants | Yemen | 0.0 /100 | #345 | Tragic 8.2% |
| Yup'ik | 0.0 /100 | #346 | Tragic 9.1% |