Immigrants from Iraq vs Immigrants from Jamaica Unemployment Among Ages 16 to 19 years
COMPARE
Immigrants from Iraq
Immigrants from Jamaica
Unemployment Among Ages 16 to 19 years
Unemployment Among Ages 16 to 19 years Comparison
Immigrants from Iraq
Immigrants from Jamaica
17.0%
UNEMPLOYMENT AMONG AGES 16 TO 19 YEARS
93.7/ 100
METRIC RATING
112th/ 347
METRIC RANK
22.2%
UNEMPLOYMENT AMONG AGES 16 TO 19 YEARS
0.0/ 100
METRIC RATING
318th/ 347
METRIC RANK
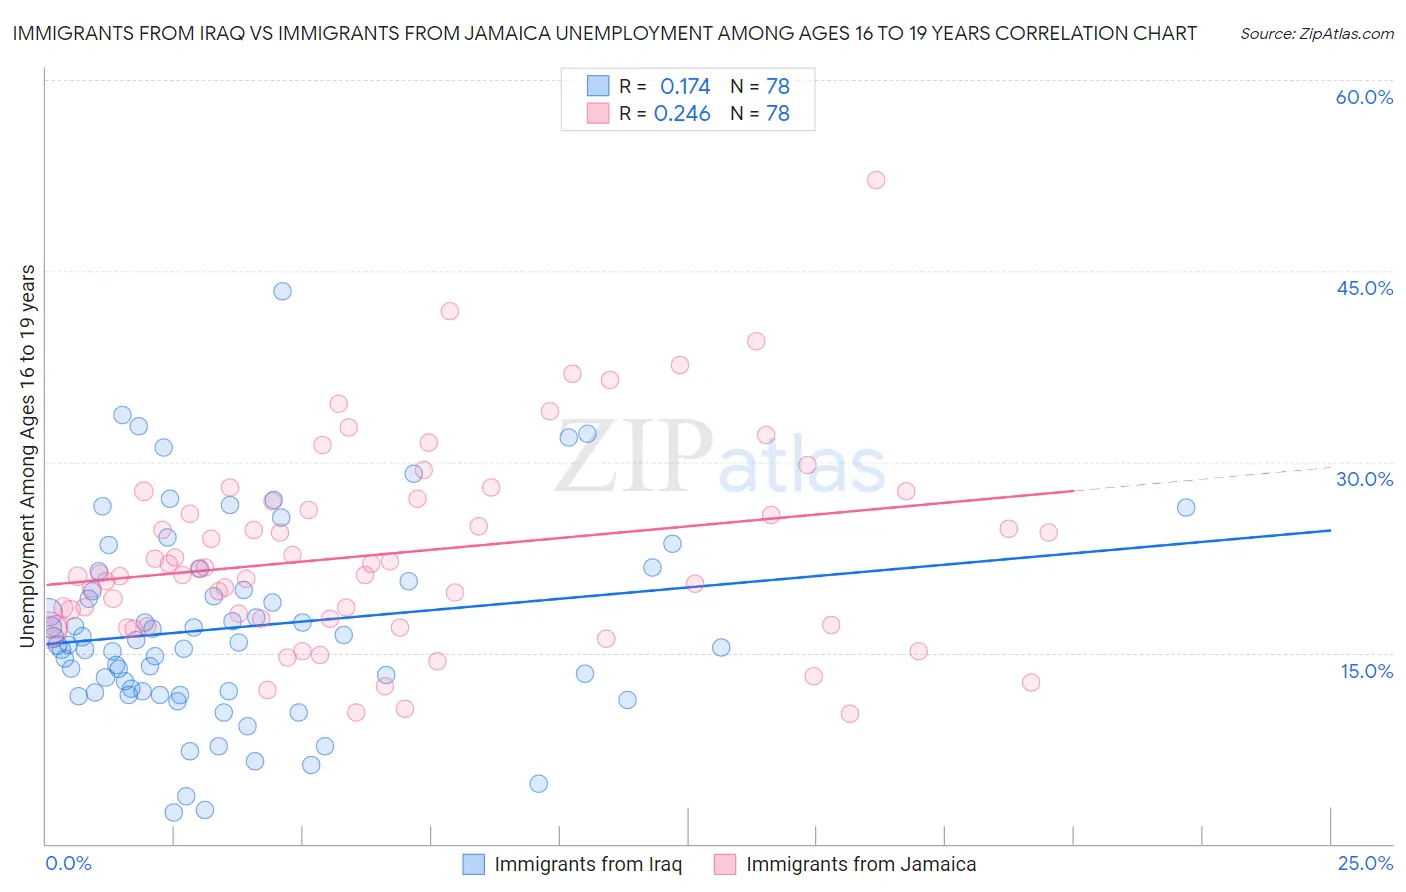
Immigrants from Iraq vs Immigrants from Jamaica Unemployment Among Ages 16 to 19 years Correlation Chart
The statistical analysis conducted on geographies consisting of 189,846,896 people shows a poor positive correlation between the proportion of Immigrants from Iraq and unemployment rate among population between the ages 16 and 19 in the United States with a correlation coefficient (R) of 0.174 and weighted average of 17.0%. Similarly, the statistical analysis conducted on geographies consisting of 289,656,890 people shows a weak positive correlation between the proportion of Immigrants from Jamaica and unemployment rate among population between the ages 16 and 19 in the United States with a correlation coefficient (R) of 0.246 and weighted average of 22.2%, a difference of 30.4%.
Unemployment Among Ages 16 to 19 years Correlation Summary
| Measurement | Immigrants from Iraq | Immigrants from Jamaica |
| Minimum | 2.5% | 10.2% |
| Maximum | 43.4% | 52.1% |
| Range | 40.9% | 41.9% |
| Mean | 17.0% | 22.8% |
| Median | 15.7% | 21.2% |
| Interquartile 25% (IQ1) | 12.0% | 17.2% |
| Interquartile 75% (IQ3) | 20.6% | 26.9% |
| Interquartile Range (IQR) | 8.6% | 9.7% |
| Standard Deviation (Sample) | 7.7% | 7.8% |
| Standard Deviation (Population) | 7.7% | 7.8% |
Similar Demographics by Unemployment Among Ages 16 to 19 years
Demographics Similar to Immigrants from Iraq by Unemployment Among Ages 16 to 19 years
In terms of unemployment among ages 16 to 19 years, the demographic groups most similar to Immigrants from Iraq are Immigrants from Asia (17.0%, a difference of 0.030%), Immigrants from Netherlands (17.0%, a difference of 0.040%), Icelander (17.0%, a difference of 0.060%), Iranian (17.0%, a difference of 0.080%), and Immigrants from Brazil (17.0%, a difference of 0.10%).
| Demographics | Rating | Rank | Unemployment Among Ages 16 to 19 years |
| Immigrants | Bulgaria | 94.3 /100 | #105 | Exceptional 17.0% |
| Estonians | 94.3 /100 | #106 | Exceptional 17.0% |
| Immigrants | Brazil | 94.2 /100 | #107 | Exceptional 17.0% |
| Malaysians | 94.2 /100 | #108 | Exceptional 17.0% |
| Iranians | 94.1 /100 | #109 | Exceptional 17.0% |
| Immigrants | Netherlands | 93.9 /100 | #110 | Exceptional 17.0% |
| Immigrants | Asia | 93.9 /100 | #111 | Exceptional 17.0% |
| Immigrants | Iraq | 93.7 /100 | #112 | Exceptional 17.0% |
| Icelanders | 93.4 /100 | #113 | Exceptional 17.0% |
| Immigrants | Poland | 93.1 /100 | #114 | Exceptional 17.0% |
| Brazilians | 92.3 /100 | #115 | Exceptional 17.1% |
| Immigrants | Korea | 92.2 /100 | #116 | Exceptional 17.1% |
| Immigrants | Sri Lanka | 92.0 /100 | #117 | Exceptional 17.1% |
| Venezuelans | 91.8 /100 | #118 | Exceptional 17.1% |
| Hungarians | 91.6 /100 | #119 | Exceptional 17.1% |
Demographics Similar to Immigrants from Jamaica by Unemployment Among Ages 16 to 19 years
In terms of unemployment among ages 16 to 19 years, the demographic groups most similar to Immigrants from Jamaica are Immigrants from Belize (22.2%, a difference of 0.15%), Immigrants from West Indies (22.2%, a difference of 0.16%), Cheyenne (22.3%, a difference of 0.39%), Tohono O'odham (22.1%, a difference of 0.59%), and West Indian (22.4%, a difference of 1.1%).
| Demographics | Rating | Rank | Unemployment Among Ages 16 to 19 years |
| Belizeans | 0.0 /100 | #311 | Tragic 21.6% |
| Houma | 0.0 /100 | #312 | Tragic 21.6% |
| Jamaicans | 0.0 /100 | #313 | Tragic 21.7% |
| Alaska Natives | 0.0 /100 | #314 | Tragic 21.8% |
| Immigrants | Dominica | 0.0 /100 | #315 | Tragic 21.9% |
| Tohono O'odham | 0.0 /100 | #316 | Tragic 22.1% |
| Immigrants | Belize | 0.0 /100 | #317 | Tragic 22.2% |
| Immigrants | Jamaica | 0.0 /100 | #318 | Tragic 22.2% |
| Immigrants | West Indies | 0.0 /100 | #319 | Tragic 22.2% |
| Cheyenne | 0.0 /100 | #320 | Tragic 22.3% |
| West Indians | 0.0 /100 | #321 | Tragic 22.4% |
| Barbadians | 0.0 /100 | #322 | Tragic 22.5% |
| Yakama | 0.0 /100 | #323 | Tragic 22.5% |
| Immigrants | Armenia | 0.0 /100 | #324 | Tragic 22.6% |
| Trinidadians and Tobagonians | 0.0 /100 | #325 | Tragic 22.6% |