Immigrants from Micronesia vs Immigrants from Lithuania Male Unemployment
COMPARE
Immigrants from Micronesia
Immigrants from Lithuania
Male Unemployment
Male Unemployment Comparison
Immigrants from Micronesia
Immigrants from Lithuania
5.6%
MALE UNEMPLOYMENT
2.9/ 100
METRIC RATING
222nd/ 347
METRIC RANK
5.1%
MALE UNEMPLOYMENT
87.2/ 100
METRIC RATING
125th/ 347
METRIC RANK
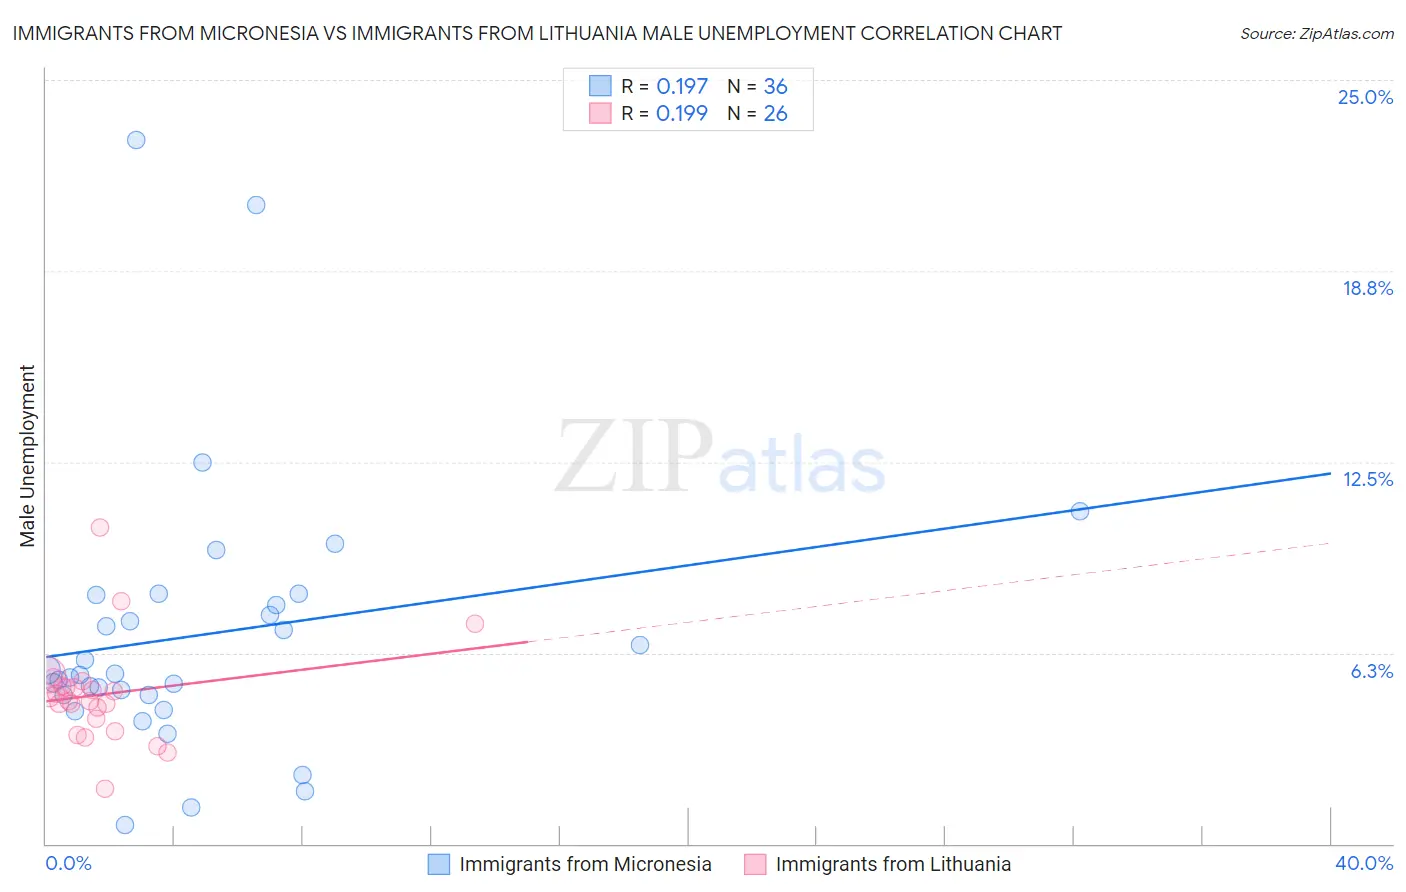
Immigrants from Micronesia vs Immigrants from Lithuania Male Unemployment Correlation Chart
The statistical analysis conducted on geographies consisting of 61,517,002 people shows a poor positive correlation between the proportion of Immigrants from Micronesia and unemployment rate among males in the United States with a correlation coefficient (R) of 0.197 and weighted average of 5.6%. Similarly, the statistical analysis conducted on geographies consisting of 117,611,759 people shows a poor positive correlation between the proportion of Immigrants from Lithuania and unemployment rate among males in the United States with a correlation coefficient (R) of 0.199 and weighted average of 5.1%, a difference of 8.1%.
Male Unemployment Correlation Summary
| Measurement | Immigrants from Micronesia | Immigrants from Lithuania |
| Minimum | 0.60% | 1.8% |
| Maximum | 23.0% | 10.4% |
| Range | 22.4% | 8.5% |
| Mean | 6.8% | 4.9% |
| Median | 5.5% | 4.7% |
| Interquartile 25% (IQ1) | 4.9% | 4.1% |
| Interquartile 75% (IQ3) | 8.0% | 5.1% |
| Interquartile Range (IQR) | 3.1% | 1.1% |
| Standard Deviation (Sample) | 4.5% | 1.6% |
| Standard Deviation (Population) | 4.4% | 1.6% |
Similar Demographics by Male Unemployment
Demographics Similar to Immigrants from Micronesia by Male Unemployment
In terms of male unemployment, the demographic groups most similar to Immigrants from Micronesia are Soviet Union (5.6%, a difference of 0.14%), Creek (5.6%, a difference of 0.15%), Portuguese (5.6%, a difference of 0.25%), Immigrants from Western Asia (5.6%, a difference of 0.27%), and Cherokee (5.6%, a difference of 0.28%).
| Demographics | Rating | Rank | Male Unemployment |
| Samoans | 4.9 /100 | #215 | Tragic 5.5% |
| Immigrants | Immigrants | 4.3 /100 | #216 | Tragic 5.5% |
| Delaware | 4.2 /100 | #217 | Tragic 5.5% |
| Immigrants | Albania | 3.6 /100 | #218 | Tragic 5.5% |
| Immigrants | Western Asia | 3.5 /100 | #219 | Tragic 5.6% |
| Portuguese | 3.5 /100 | #220 | Tragic 5.6% |
| Soviet Union | 3.2 /100 | #221 | Tragic 5.6% |
| Immigrants | Micronesia | 2.9 /100 | #222 | Tragic 5.6% |
| Creek | 2.6 /100 | #223 | Tragic 5.6% |
| Cherokee | 2.4 /100 | #224 | Tragic 5.6% |
| Panamanians | 1.9 /100 | #225 | Tragic 5.6% |
| Immigrants | Cambodia | 1.8 /100 | #226 | Tragic 5.6% |
| Immigrants | Panama | 1.8 /100 | #227 | Tragic 5.6% |
| Seminole | 1.8 /100 | #228 | Tragic 5.6% |
| Central Americans | 1.8 /100 | #229 | Tragic 5.6% |
Demographics Similar to Immigrants from Lithuania by Male Unemployment
In terms of male unemployment, the demographic groups most similar to Immigrants from Lithuania are Immigrants from Latvia (5.1%, a difference of 0.040%), Immigrants from Colombia (5.1%, a difference of 0.060%), Palestinian (5.1%, a difference of 0.070%), Immigrants from Brazil (5.2%, a difference of 0.11%), and Nicaraguan (5.1%, a difference of 0.14%).
| Demographics | Rating | Rank | Male Unemployment |
| Cypriots | 88.8 /100 | #118 | Excellent 5.1% |
| French Canadians | 88.6 /100 | #119 | Excellent 5.1% |
| Ukrainians | 88.4 /100 | #120 | Excellent 5.1% |
| Mongolians | 88.4 /100 | #121 | Excellent 5.1% |
| Nicaraguans | 88.2 /100 | #122 | Excellent 5.1% |
| Palestinians | 87.7 /100 | #123 | Excellent 5.1% |
| Immigrants | Latvia | 87.5 /100 | #124 | Excellent 5.1% |
| Immigrants | Lithuania | 87.2 /100 | #125 | Excellent 5.1% |
| Immigrants | Colombia | 86.8 /100 | #126 | Excellent 5.1% |
| Immigrants | Brazil | 86.3 /100 | #127 | Excellent 5.2% |
| Hungarians | 85.1 /100 | #128 | Excellent 5.2% |
| Immigrants | Western Europe | 84.8 /100 | #129 | Excellent 5.2% |
| Immigrants | Malaysia | 83.5 /100 | #130 | Excellent 5.2% |
| Immigrants | Germany | 83.0 /100 | #131 | Excellent 5.2% |
| Chickasaw | 82.9 /100 | #132 | Excellent 5.2% |