Immigrants from Nigeria vs Immigrants from Belarus Unemployment Among Seniors over 75 years
COMPARE
Immigrants from Nigeria
Immigrants from Belarus
Unemployment Among Seniors over 75 years
Unemployment Among Seniors over 75 years Comparison
Immigrants from Nigeria
Immigrants from Belarus
9.6%
UNEMPLOYMENT AMONG SENIORS OVER 75 YEARS
0.0/ 100
METRIC RATING
283rd/ 347
METRIC RANK
8.0%
UNEMPLOYMENT AMONG SENIORS OVER 75 YEARS
99.8/ 100
METRIC RATING
78th/ 347
METRIC RANK
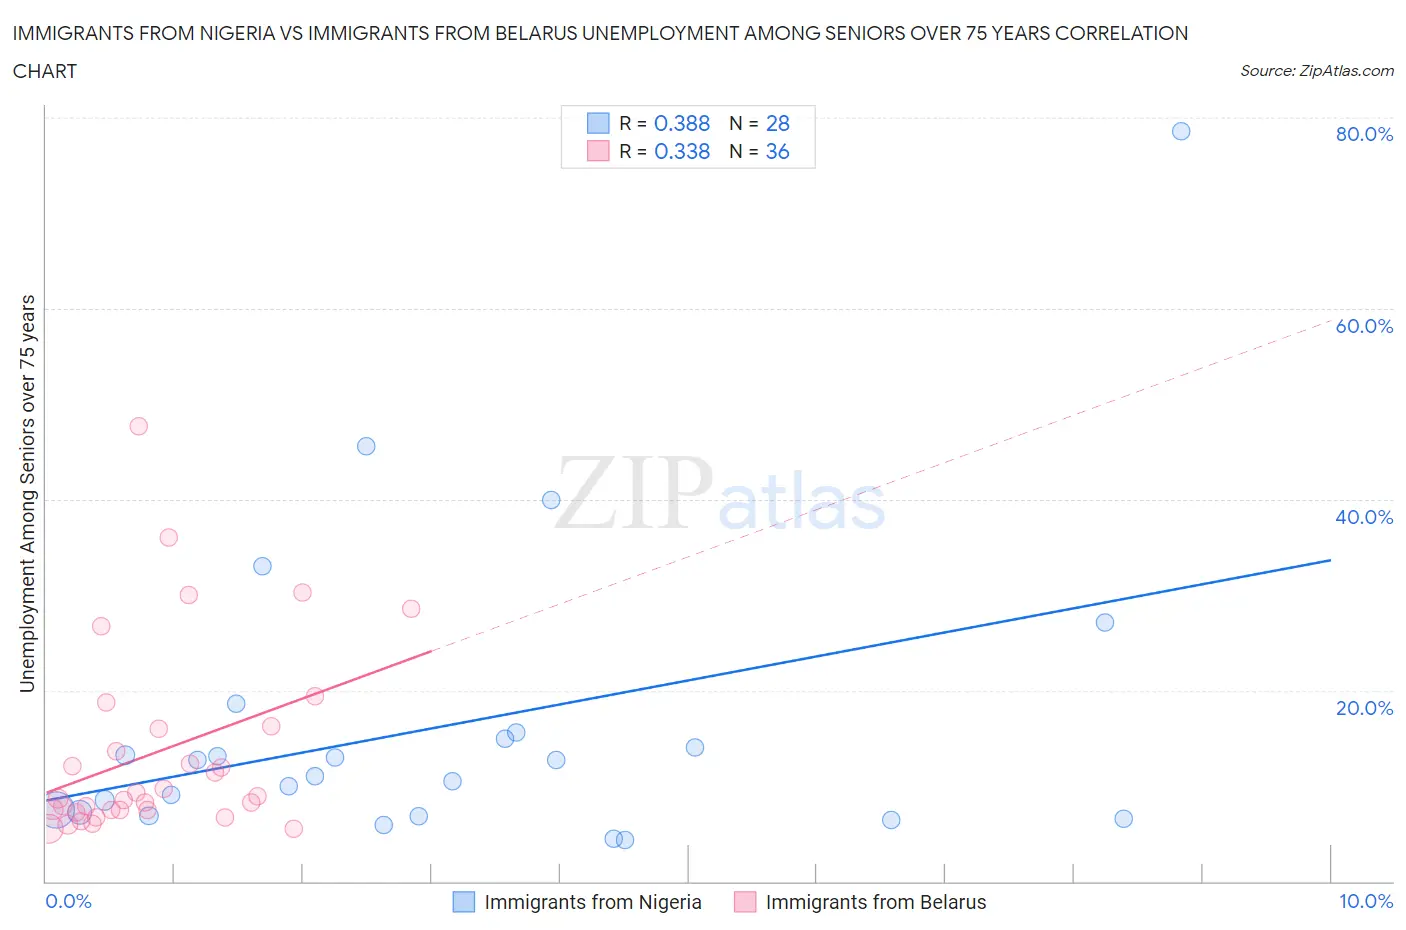
Immigrants from Nigeria vs Immigrants from Belarus Unemployment Among Seniors over 75 years Correlation Chart
The statistical analysis conducted on geographies consisting of 160,553,322 people shows a mild positive correlation between the proportion of Immigrants from Nigeria and unemployment rate among seniors over the age of 75 in the United States with a correlation coefficient (R) of 0.388 and weighted average of 9.6%. Similarly, the statistical analysis conducted on geographies consisting of 106,145,567 people shows a mild positive correlation between the proportion of Immigrants from Belarus and unemployment rate among seniors over the age of 75 in the United States with a correlation coefficient (R) of 0.338 and weighted average of 8.0%, a difference of 20.1%.
Unemployment Among Seniors over 75 years Correlation Summary
| Measurement | Immigrants from Nigeria | Immigrants from Belarus |
| Minimum | 4.3% | 5.5% |
| Maximum | 78.6% | 47.7% |
| Range | 74.3% | 42.2% |
| Mean | 16.3% | 13.6% |
| Median | 11.8% | 8.8% |
| Interquartile 25% (IQ1) | 7.0% | 7.5% |
| Interquartile 75% (IQ3) | 15.2% | 16.1% |
| Interquartile Range (IQR) | 8.2% | 8.6% |
| Standard Deviation (Sample) | 16.0% | 10.0% |
| Standard Deviation (Population) | 15.7% | 9.9% |
Similar Demographics by Unemployment Among Seniors over 75 years
Demographics Similar to Immigrants from Nigeria by Unemployment Among Seniors over 75 years
In terms of unemployment among seniors over 75 years, the demographic groups most similar to Immigrants from Nigeria are Macedonian (9.6%, a difference of 0.030%), European (9.7%, a difference of 0.21%), Carpatho Rusyn (9.7%, a difference of 0.24%), Nigerian (9.7%, a difference of 0.31%), and Bangladeshi (9.6%, a difference of 0.38%).
| Demographics | Rating | Rank | Unemployment Among Seniors over 75 years |
| Arabs | 0.2 /100 | #276 | Tragic 9.5% |
| Swiss | 0.1 /100 | #277 | Tragic 9.5% |
| Immigrants | Senegal | 0.1 /100 | #278 | Tragic 9.6% |
| British | 0.1 /100 | #279 | Tragic 9.6% |
| Croatians | 0.1 /100 | #280 | Tragic 9.6% |
| Bangladeshis | 0.1 /100 | #281 | Tragic 9.6% |
| Macedonians | 0.0 /100 | #282 | Tragic 9.6% |
| Immigrants | Nigeria | 0.0 /100 | #283 | Tragic 9.6% |
| Europeans | 0.0 /100 | #284 | Tragic 9.7% |
| Carpatho Rusyns | 0.0 /100 | #285 | Tragic 9.7% |
| Nigerians | 0.0 /100 | #286 | Tragic 9.7% |
| Danes | 0.0 /100 | #287 | Tragic 9.7% |
| Canadians | 0.0 /100 | #288 | Tragic 9.7% |
| Czechs | 0.0 /100 | #289 | Tragic 9.7% |
| Sioux | 0.0 /100 | #290 | Tragic 9.7% |
Demographics Similar to Immigrants from Belarus by Unemployment Among Seniors over 75 years
In terms of unemployment among seniors over 75 years, the demographic groups most similar to Immigrants from Belarus are Immigrants from Turkey (8.0%, a difference of 0.030%), Immigrants from Venezuela (8.0%, a difference of 0.080%), Immigrants from Uganda (8.0%, a difference of 0.19%), Immigrants from Japan (8.0%, a difference of 0.20%), and Immigrants from Australia (8.0%, a difference of 0.22%).
| Demographics | Rating | Rank | Unemployment Among Seniors over 75 years |
| Immigrants | Cambodia | 99.9 /100 | #71 | Exceptional 8.0% |
| Bolivians | 99.9 /100 | #72 | Exceptional 8.0% |
| Immigrants | France | 99.9 /100 | #73 | Exceptional 8.0% |
| Spanish Americans | 99.8 /100 | #74 | Exceptional 8.0% |
| Immigrants | Uganda | 99.8 /100 | #75 | Exceptional 8.0% |
| Immigrants | Venezuela | 99.8 /100 | #76 | Exceptional 8.0% |
| Immigrants | Turkey | 99.8 /100 | #77 | Exceptional 8.0% |
| Immigrants | Belarus | 99.8 /100 | #78 | Exceptional 8.0% |
| Immigrants | Japan | 99.7 /100 | #79 | Exceptional 8.0% |
| Immigrants | Australia | 99.7 /100 | #80 | Exceptional 8.0% |
| Cubans | 99.7 /100 | #81 | Exceptional 8.0% |
| Bhutanese | 99.7 /100 | #82 | Exceptional 8.0% |
| Arapaho | 99.7 /100 | #83 | Exceptional 8.1% |
| U.S. Virgin Islanders | 99.7 /100 | #84 | Exceptional 8.1% |
| Immigrants | Indonesia | 99.7 /100 | #85 | Exceptional 8.1% |