Immigrants from Oceania vs Immigrants from Costa Rica Male Unemployment
COMPARE
Immigrants from Oceania
Immigrants from Costa Rica
Male Unemployment
Male Unemployment Comparison
Immigrants from Oceania
Immigrants from Costa Rica
5.3%
MALE UNEMPLOYMENT
40.8/ 100
METRIC RATING
179th/ 347
METRIC RANK
5.5%
MALE UNEMPLOYMENT
11.4/ 100
METRIC RATING
205th/ 347
METRIC RANK
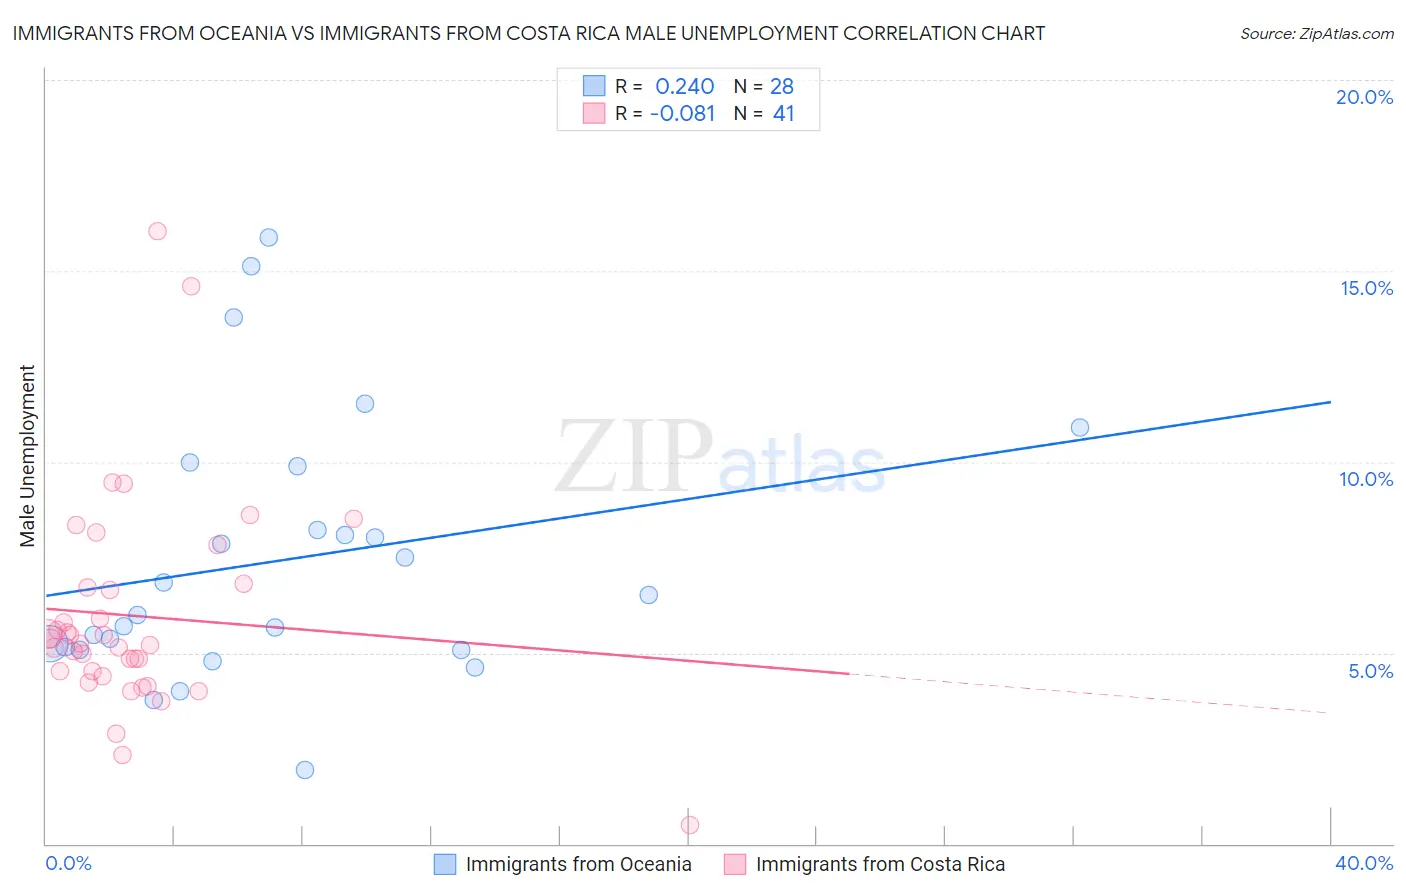
Immigrants from Oceania vs Immigrants from Costa Rica Male Unemployment Correlation Chart
The statistical analysis conducted on geographies consisting of 304,471,992 people shows a weak positive correlation between the proportion of Immigrants from Oceania and unemployment rate among males in the United States with a correlation coefficient (R) of 0.240 and weighted average of 5.3%. Similarly, the statistical analysis conducted on geographies consisting of 204,074,959 people shows a slight negative correlation between the proportion of Immigrants from Costa Rica and unemployment rate among males in the United States with a correlation coefficient (R) of -0.081 and weighted average of 5.5%, a difference of 2.4%.
Male Unemployment Correlation Summary
| Measurement | Immigrants from Oceania | Immigrants from Costa Rica |
| Minimum | 1.9% | 0.50% |
| Maximum | 15.9% | 16.0% |
| Range | 13.9% | 15.5% |
| Mean | 7.4% | 6.0% |
| Median | 6.3% | 5.3% |
| Interquartile 25% (IQ1) | 5.1% | 4.5% |
| Interquartile 75% (IQ3) | 9.0% | 6.8% |
| Interquartile Range (IQR) | 3.9% | 2.3% |
| Standard Deviation (Sample) | 3.5% | 2.8% |
| Standard Deviation (Population) | 3.4% | 2.8% |
Similar Demographics by Male Unemployment
Demographics Similar to Immigrants from Oceania by Male Unemployment
In terms of male unemployment, the demographic groups most similar to Immigrants from Oceania are Malaysian (5.3%, a difference of 0.070%), Osage (5.3%, a difference of 0.10%), Immigrants from Afghanistan (5.3%, a difference of 0.18%), Potawatomi (5.3%, a difference of 0.18%), and Taiwanese (5.3%, a difference of 0.20%).
| Demographics | Rating | Rank | Male Unemployment |
| Immigrants | Kazakhstan | 50.8 /100 | #172 | Average 5.3% |
| Immigrants | Russia | 50.7 /100 | #173 | Average 5.3% |
| Immigrants | Iran | 50.0 /100 | #174 | Average 5.3% |
| Immigrants | Iraq | 48.1 /100 | #175 | Average 5.3% |
| Immigrants | Poland | 46.0 /100 | #176 | Average 5.3% |
| Immigrants | Peru | 44.6 /100 | #177 | Average 5.3% |
| Osage | 42.5 /100 | #178 | Average 5.3% |
| Immigrants | Oceania | 40.8 /100 | #179 | Average 5.3% |
| Malaysians | 39.6 /100 | #180 | Fair 5.3% |
| Immigrants | Afghanistan | 37.9 /100 | #181 | Fair 5.3% |
| Potawatomi | 37.8 /100 | #182 | Fair 5.3% |
| Taiwanese | 37.6 /100 | #183 | Fair 5.3% |
| Spaniards | 35.1 /100 | #184 | Fair 5.3% |
| Koreans | 34.9 /100 | #185 | Fair 5.3% |
| Iraqis | 31.6 /100 | #186 | Fair 5.4% |
Demographics Similar to Immigrants from Costa Rica by Male Unemployment
In terms of male unemployment, the demographic groups most similar to Immigrants from Costa Rica are Guamanian/Chamorro (5.4%, a difference of 0.13%), Immigrants from Laos (5.4%, a difference of 0.22%), Immigrants from Ukraine (5.5%, a difference of 0.22%), Nonimmigrants (5.4%, a difference of 0.23%), and Immigrants from Philippines (5.4%, a difference of 0.27%).
| Demographics | Rating | Rank | Male Unemployment |
| Immigrants | Thailand | 14.7 /100 | #198 | Poor 5.4% |
| Immigrants | Greece | 14.5 /100 | #199 | Poor 5.4% |
| Immigrants | Zaire | 13.7 /100 | #200 | Poor 5.4% |
| Immigrants | Philippines | 13.5 /100 | #201 | Poor 5.4% |
| Immigrants | Nonimmigrants | 13.1 /100 | #202 | Poor 5.4% |
| Immigrants | Laos | 13.0 /100 | #203 | Poor 5.4% |
| Guamanians/Chamorros | 12.3 /100 | #204 | Poor 5.4% |
| Immigrants | Costa Rica | 11.4 /100 | #205 | Poor 5.5% |
| Immigrants | Ukraine | 9.9 /100 | #206 | Tragic 5.5% |
| Immigrants | Syria | 9.3 /100 | #207 | Tragic 5.5% |
| Immigrants | Lebanon | 8.6 /100 | #208 | Tragic 5.5% |
| Immigrants | Middle Africa | 8.3 /100 | #209 | Tragic 5.5% |
| South American Indians | 7.6 /100 | #210 | Tragic 5.5% |
| Israelis | 7.4 /100 | #211 | Tragic 5.5% |
| Hmong | 7.0 /100 | #212 | Tragic 5.5% |