Immigrants from Singapore vs Immigrants from Denmark Unemployment
COMPARE
Immigrants from Singapore
Immigrants from Denmark
Unemployment
Unemployment Comparison
Immigrants from Singapore
Immigrants from Denmark
4.9%
UNEMPLOYMENT
99.1/ 100
METRIC RATING
57th/ 347
METRIC RANK
5.1%
UNEMPLOYMENT
84.3/ 100
METRIC RATING
140th/ 347
METRIC RANK
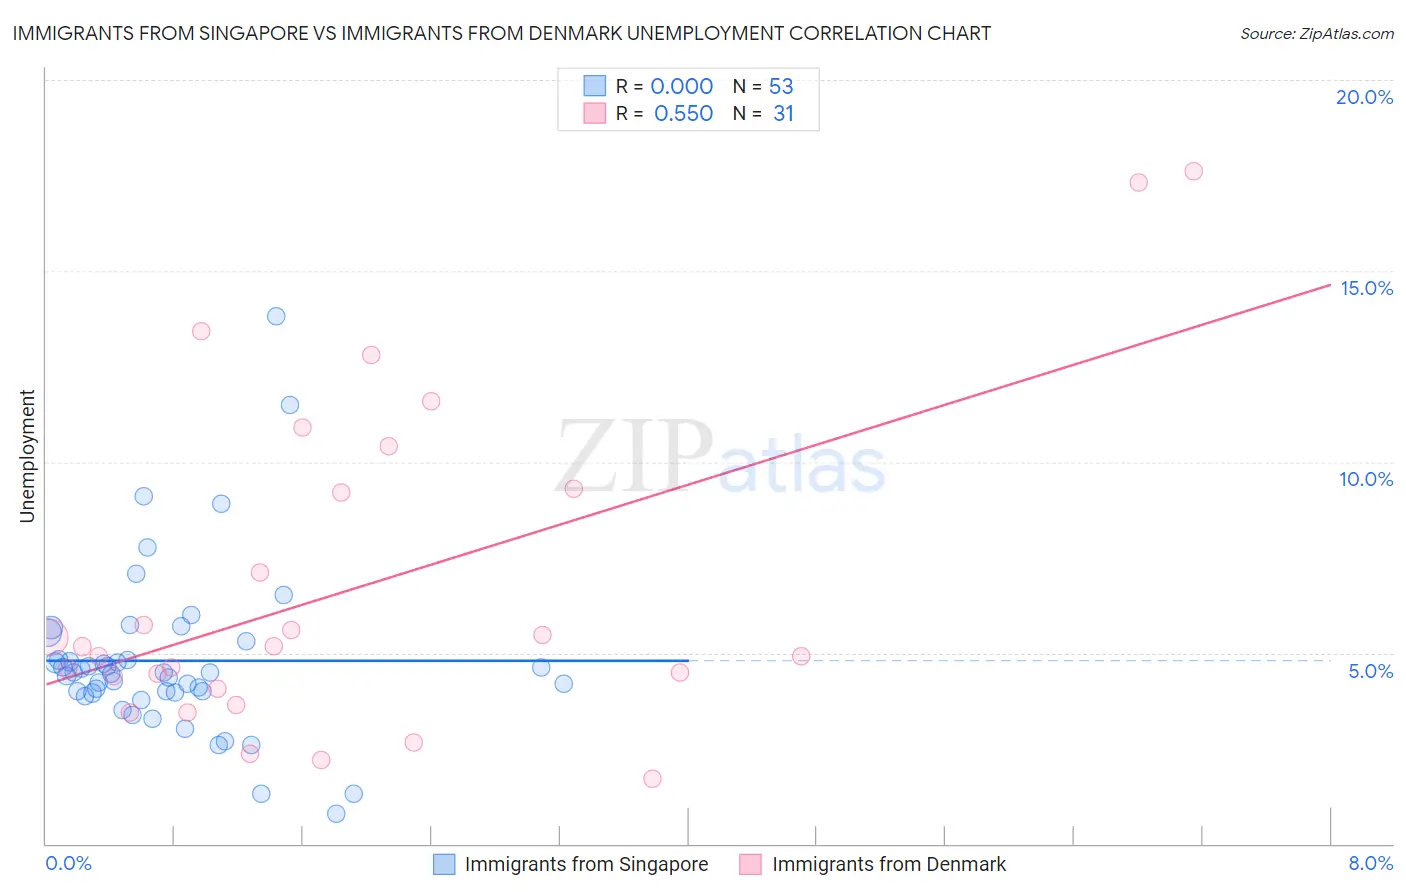
Immigrants from Singapore vs Immigrants from Denmark Unemployment Correlation Chart
The statistical analysis conducted on geographies consisting of 137,508,284 people shows no correlation between the proportion of Immigrants from Singapore and unemployment in the United States with a correlation coefficient (R) of 0.000 and weighted average of 4.9%. Similarly, the statistical analysis conducted on geographies consisting of 136,363,716 people shows a substantial positive correlation between the proportion of Immigrants from Denmark and unemployment in the United States with a correlation coefficient (R) of 0.550 and weighted average of 5.1%, a difference of 4.9%.
Unemployment Correlation Summary
| Measurement | Immigrants from Singapore | Immigrants from Denmark |
| Minimum | 0.80% | 1.7% |
| Maximum | 13.8% | 17.6% |
| Range | 13.0% | 15.9% |
| Mean | 4.8% | 6.7% |
| Median | 4.5% | 5.2% |
| Interquartile 25% (IQ1) | 3.9% | 4.0% |
| Interquartile 75% (IQ3) | 5.1% | 9.3% |
| Interquartile Range (IQR) | 1.1% | 5.3% |
| Standard Deviation (Sample) | 2.2% | 4.2% |
| Standard Deviation (Population) | 2.2% | 4.2% |
Similar Demographics by Unemployment
Demographics Similar to Immigrants from Singapore by Unemployment
In terms of unemployment, the demographic groups most similar to Immigrants from Singapore are Celtic (4.9%, a difference of 0.070%), Greek (4.9%, a difference of 0.10%), Bhutanese (4.9%, a difference of 0.13%), Immigrants from Netherlands (4.9%, a difference of 0.17%), and Cambodian (4.9%, a difference of 0.17%).
| Demographics | Rating | Rank | Unemployment |
| French Canadians | 99.3 /100 | #50 | Exceptional 4.9% |
| Immigrants | Belgium | 99.2 /100 | #51 | Exceptional 4.9% |
| Whites/Caucasians | 99.2 /100 | #52 | Exceptional 4.9% |
| Immigrants | Zimbabwe | 99.2 /100 | #53 | Exceptional 4.9% |
| Eastern Europeans | 99.2 /100 | #54 | Exceptional 4.9% |
| Australians | 99.2 /100 | #55 | Exceptional 4.9% |
| Celtics | 99.1 /100 | #56 | Exceptional 4.9% |
| Immigrants | Singapore | 99.1 /100 | #57 | Exceptional 4.9% |
| Greeks | 99.0 /100 | #58 | Exceptional 4.9% |
| Bhutanese | 99.0 /100 | #59 | Exceptional 4.9% |
| Immigrants | Netherlands | 99.0 /100 | #60 | Exceptional 4.9% |
| Cambodians | 99.0 /100 | #61 | Exceptional 4.9% |
| Icelanders | 98.9 /100 | #62 | Exceptional 4.9% |
| Immigrants | Bulgaria | 98.9 /100 | #63 | Exceptional 4.9% |
| Italians | 98.9 /100 | #64 | Exceptional 4.9% |
Demographics Similar to Immigrants from Denmark by Unemployment
In terms of unemployment, the demographic groups most similar to Immigrants from Denmark are Palestinian (5.1%, a difference of 0.11%), Immigrants from Pakistan (5.1%, a difference of 0.12%), Pakistani (5.1%, a difference of 0.13%), Immigrants from Hungary (5.1%, a difference of 0.16%), and Immigrants from Saudi Arabia (5.1%, a difference of 0.17%).
| Demographics | Rating | Rank | Unemployment |
| Immigrants | Jordan | 86.6 /100 | #133 | Excellent 5.1% |
| Immigrants | Europe | 86.3 /100 | #134 | Excellent 5.1% |
| Immigrants | Burma/Myanmar | 86.2 /100 | #135 | Excellent 5.1% |
| Immigrants | Spain | 86.2 /100 | #136 | Excellent 5.1% |
| Immigrants | Saudi Arabia | 85.6 /100 | #137 | Excellent 5.1% |
| Immigrants | Hungary | 85.6 /100 | #138 | Excellent 5.1% |
| Pakistanis | 85.3 /100 | #139 | Excellent 5.1% |
| Immigrants | Denmark | 84.3 /100 | #140 | Excellent 5.1% |
| Palestinians | 83.4 /100 | #141 | Excellent 5.1% |
| Immigrants | Pakistan | 83.2 /100 | #142 | Excellent 5.1% |
| Immigrants | Chile | 82.8 /100 | #143 | Excellent 5.1% |
| Indonesians | 82.3 /100 | #144 | Excellent 5.1% |
| Immigrants | Norway | 81.8 /100 | #145 | Excellent 5.1% |
| Immigrants | Asia | 81.8 /100 | #146 | Excellent 5.1% |
| Indians (Asian) | 81.6 /100 | #147 | Excellent 5.1% |