Immigrants from Singapore vs Shoshone Unemployment Among Women with Children Under 18 years
COMPARE
Immigrants from Singapore
Shoshone
Unemployment Among Women with Children Under 18 years
Unemployment Among Women with Children Under 18 years Comparison
Immigrants from Singapore
Shoshone
4.9%
UNEMPLOYMENT AMONG WOMEN WITH CHILDREN UNDER 18 YEARS
99.8/ 100
METRIC RATING
17th/ 347
METRIC RANK
6.6%
UNEMPLOYMENT AMONG WOMEN WITH CHILDREN UNDER 18 YEARS
0.0/ 100
METRIC RATING
317th/ 347
METRIC RANK
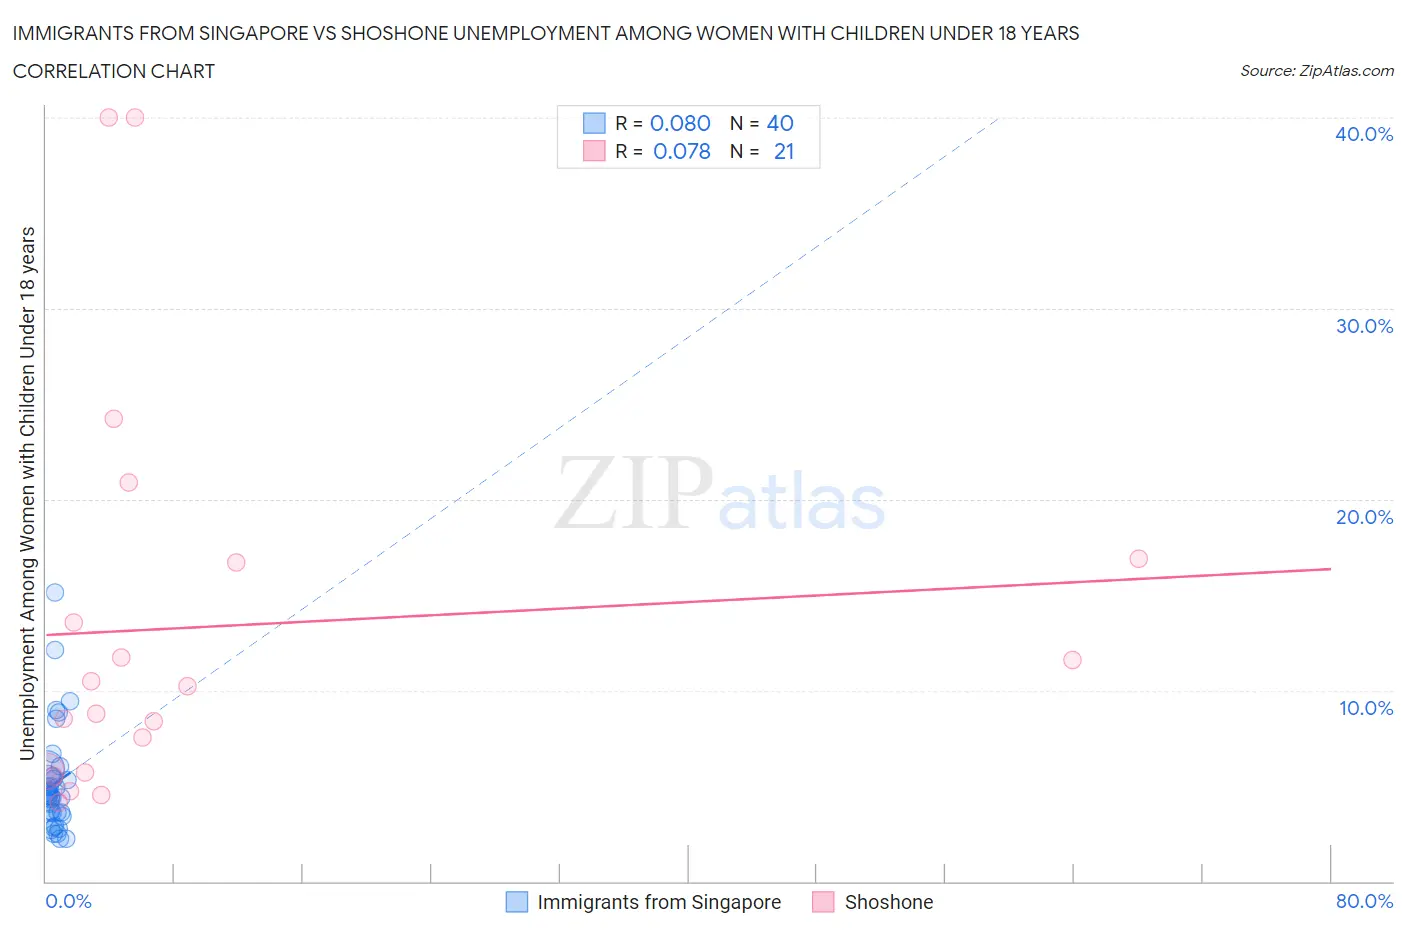
Immigrants from Singapore vs Shoshone Unemployment Among Women with Children Under 18 years Correlation Chart
The statistical analysis conducted on geographies consisting of 135,664,542 people shows a slight positive correlation between the proportion of Immigrants from Singapore and unemployment rate among women with children under the age of 18 in the United States with a correlation coefficient (R) of 0.080 and weighted average of 4.9%. Similarly, the statistical analysis conducted on geographies consisting of 65,640,123 people shows a slight positive correlation between the proportion of Shoshone and unemployment rate among women with children under the age of 18 in the United States with a correlation coefficient (R) of 0.078 and weighted average of 6.6%, a difference of 36.7%.
Unemployment Among Women with Children Under 18 years Correlation Summary
| Measurement | Immigrants from Singapore | Shoshone |
| Minimum | 2.2% | 4.1% |
| Maximum | 15.1% | 40.0% |
| Range | 12.9% | 35.9% |
| Mean | 5.1% | 13.3% |
| Median | 4.5% | 10.2% |
| Interquartile 25% (IQ1) | 3.6% | 5.7% |
| Interquartile 75% (IQ3) | 5.4% | 16.8% |
| Interquartile Range (IQR) | 1.8% | 11.1% |
| Standard Deviation (Sample) | 2.7% | 10.4% |
| Standard Deviation (Population) | 2.7% | 10.1% |
Similar Demographics by Unemployment Among Women with Children Under 18 years
Demographics Similar to Immigrants from Singapore by Unemployment Among Women with Children Under 18 years
In terms of unemployment among women with children under 18 years, the demographic groups most similar to Immigrants from Singapore are Slovene (4.9%, a difference of 0.11%), Taiwanese (4.8%, a difference of 0.20%), German (4.9%, a difference of 0.26%), Latvian (4.9%, a difference of 0.38%), and Thai (4.8%, a difference of 0.66%).
| Demographics | Rating | Rank | Unemployment Among Women with Children Under 18 years |
| Czechs | 99.9 /100 | #10 | Exceptional 4.7% |
| Filipinos | 99.9 /100 | #11 | Exceptional 4.8% |
| Scandinavians | 99.9 /100 | #12 | Exceptional 4.8% |
| Bulgarians | 99.9 /100 | #13 | Exceptional 4.8% |
| Cambodians | 99.9 /100 | #14 | Exceptional 4.8% |
| Thais | 99.8 /100 | #15 | Exceptional 4.8% |
| Taiwanese | 99.8 /100 | #16 | Exceptional 4.8% |
| Immigrants | Singapore | 99.8 /100 | #17 | Exceptional 4.9% |
| Slovenes | 99.8 /100 | #18 | Exceptional 4.9% |
| Germans | 99.8 /100 | #19 | Exceptional 4.9% |
| Latvians | 99.7 /100 | #20 | Exceptional 4.9% |
| Europeans | 99.6 /100 | #21 | Exceptional 4.9% |
| Indians (Asian) | 99.6 /100 | #22 | Exceptional 4.9% |
| Immigrants | China | 99.6 /100 | #23 | Exceptional 4.9% |
| Belgians | 99.5 /100 | #24 | Exceptional 4.9% |
Demographics Similar to Shoshone by Unemployment Among Women with Children Under 18 years
In terms of unemployment among women with children under 18 years, the demographic groups most similar to Shoshone are Immigrants from Ecuador (6.6%, a difference of 0.040%), Alaska Native (6.7%, a difference of 0.29%), British West Indian (6.6%, a difference of 0.38%), Immigrants from West Indies (6.6%, a difference of 0.38%), and Hispanic or Latino (6.6%, a difference of 0.52%).
| Demographics | Rating | Rank | Unemployment Among Women with Children Under 18 years |
| Guyanese | 0.0 /100 | #310 | Tragic 6.6% |
| Yaqui | 0.0 /100 | #311 | Tragic 6.6% |
| Immigrants | Mexico | 0.0 /100 | #312 | Tragic 6.6% |
| Hispanics or Latinos | 0.0 /100 | #313 | Tragic 6.6% |
| British West Indians | 0.0 /100 | #314 | Tragic 6.6% |
| Immigrants | West Indies | 0.0 /100 | #315 | Tragic 6.6% |
| Immigrants | Ecuador | 0.0 /100 | #316 | Tragic 6.6% |
| Shoshone | 0.0 /100 | #317 | Tragic 6.6% |
| Alaska Natives | 0.0 /100 | #318 | Tragic 6.7% |
| Central American Indians | 0.0 /100 | #319 | Tragic 6.7% |
| Immigrants | Belize | 0.0 /100 | #320 | Tragic 6.7% |
| U.S. Virgin Islanders | 0.0 /100 | #321 | Tragic 6.7% |
| Houma | 0.0 /100 | #322 | Tragic 6.8% |
| Pueblo | 0.0 /100 | #323 | Tragic 6.8% |
| Paiute | 0.0 /100 | #324 | Tragic 6.9% |