Immigrants from Western Europe vs Immigrants from Singapore Unemployment Among Ages 55 to 59 years
COMPARE
Immigrants from Western Europe
Immigrants from Singapore
Unemployment Among Ages 55 to 59 years
Unemployment Among Ages 55 to 59 years Comparison
Immigrants from Western Europe
Immigrants from Singapore
4.8%
UNEMPLOYMENT AMONG AGES 55 TO 59 YEARS
60.4/ 100
METRIC RATING
167th/ 347
METRIC RANK
4.8%
UNEMPLOYMENT AMONG AGES 55 TO 59 YEARS
76.6/ 100
METRIC RATING
147th/ 347
METRIC RANK
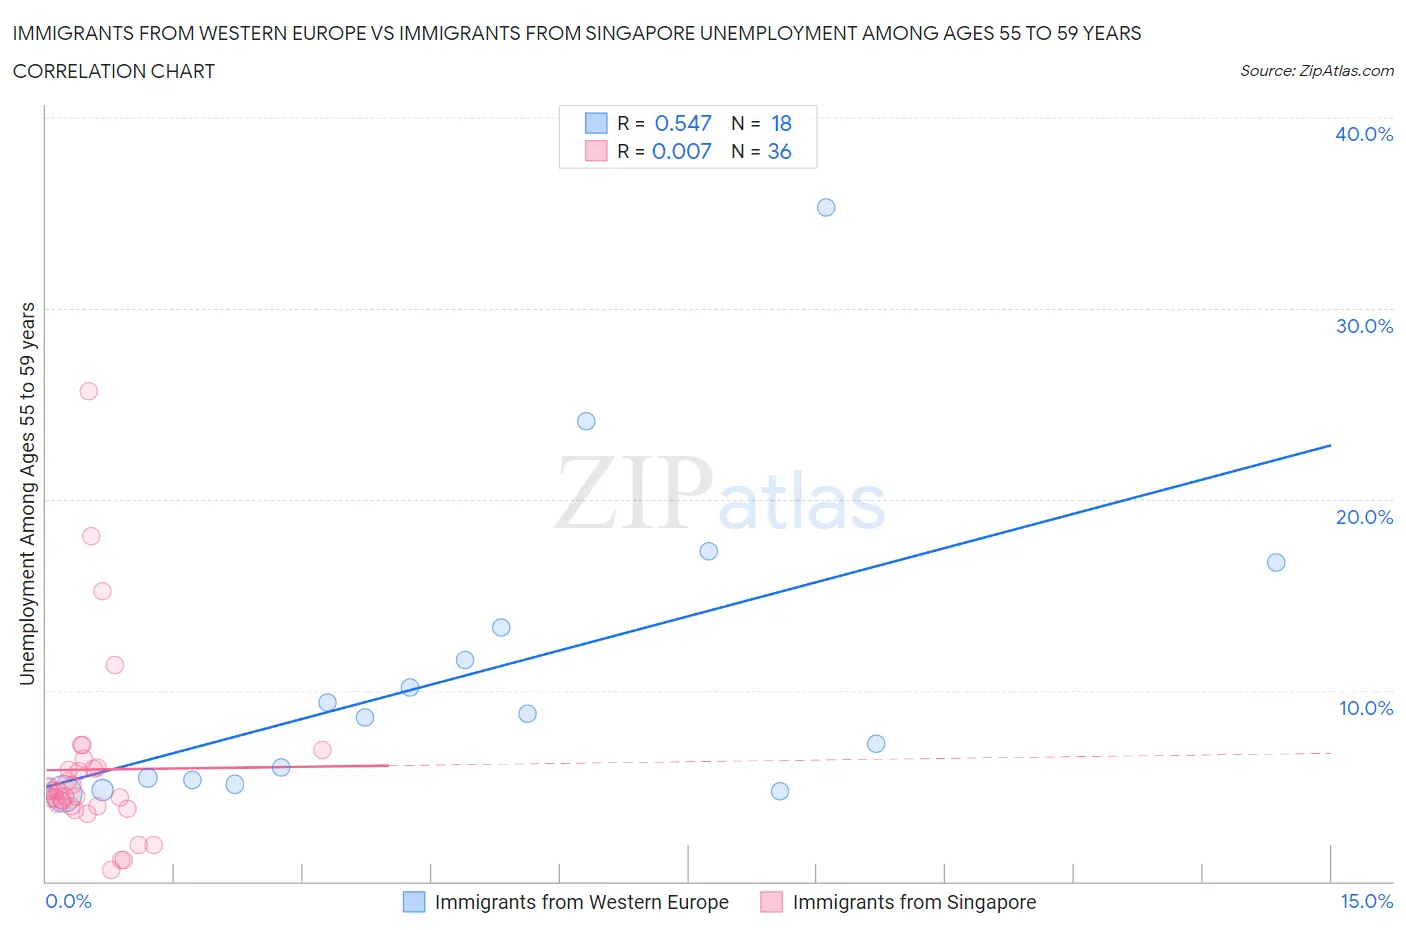
Immigrants from Western Europe vs Immigrants from Singapore Unemployment Among Ages 55 to 59 years Correlation Chart
The statistical analysis conducted on geographies consisting of 444,129,393 people shows a substantial positive correlation between the proportion of Immigrants from Western Europe and unemployment rate among population between the ages 55 and 59 in the United States with a correlation coefficient (R) of 0.547 and weighted average of 4.8%. Similarly, the statistical analysis conducted on geographies consisting of 134,284,256 people shows no correlation between the proportion of Immigrants from Singapore and unemployment rate among population between the ages 55 and 59 in the United States with a correlation coefficient (R) of 0.007 and weighted average of 4.8%, a difference of 0.79%.
Unemployment Among Ages 55 to 59 years Correlation Summary
| Measurement | Immigrants from Western Europe | Immigrants from Singapore |
| Minimum | 4.6% | 0.62% |
| Maximum | 35.3% | 25.6% |
| Range | 30.7% | 25.0% |
| Mean | 11.0% | 5.9% |
| Median | 8.7% | 4.6% |
| Interquartile 25% (IQ1) | 5.3% | 3.9% |
| Interquartile 75% (IQ3) | 13.3% | 5.9% |
| Interquartile Range (IQR) | 8.0% | 2.0% |
| Standard Deviation (Sample) | 8.1% | 4.8% |
| Standard Deviation (Population) | 7.9% | 4.8% |
Demographics Similar to Immigrants from Western Europe and Immigrants from Singapore by Unemployment Among Ages 55 to 59 years
In terms of unemployment among ages 55 to 59 years, the demographic groups most similar to Immigrants from Western Europe are Immigrants from France (4.8%, a difference of 0.070%), Potawatomi (4.8%, a difference of 0.070%), American (4.8%, a difference of 0.12%), Immigrants from Lebanon (4.8%, a difference of 0.15%), and Immigrants from Africa (4.8%, a difference of 0.17%). Similarly, the demographic groups most similar to Immigrants from Singapore are Immigrants from Bahamas (4.8%, a difference of 0.26%), Immigrants from Lithuania (4.8%, a difference of 0.31%), Immigrants from Northern Africa (4.8%, a difference of 0.36%), Bahamian (4.8%, a difference of 0.41%), and Laotian (4.8%, a difference of 0.43%).
| Demographics | Rating | Rank | Unemployment Among Ages 55 to 59 years |
| Immigrants | Singapore | 76.6 /100 | #147 | Good 4.8% |
| Immigrants | Bahamas | 71.8 /100 | #148 | Good 4.8% |
| Immigrants | Lithuania | 70.8 /100 | #149 | Good 4.8% |
| Immigrants | Northern Africa | 69.8 /100 | #150 | Good 4.8% |
| Bahamians | 68.6 /100 | #151 | Good 4.8% |
| Laotians | 68.2 /100 | #152 | Good 4.8% |
| Immigrants | Uruguay | 67.2 /100 | #153 | Good 4.8% |
| Immigrants | Panama | 66.8 /100 | #154 | Good 4.8% |
| Immigrants | North Macedonia | 66.3 /100 | #155 | Good 4.8% |
| Italians | 66.2 /100 | #156 | Good 4.8% |
| Carpatho Rusyns | 66.0 /100 | #157 | Good 4.8% |
| Slovaks | 65.3 /100 | #158 | Good 4.8% |
| Immigrants | Nicaragua | 65.2 /100 | #159 | Good 4.8% |
| Chickasaw | 65.1 /100 | #160 | Good 4.8% |
| Koreans | 64.6 /100 | #161 | Good 4.8% |
| Immigrants | Africa | 64.2 /100 | #162 | Good 4.8% |
| Immigrants | Lebanon | 63.8 /100 | #163 | Good 4.8% |
| Americans | 63.3 /100 | #164 | Good 4.8% |
| Immigrants | France | 62.0 /100 | #165 | Good 4.8% |
| Potawatomi | 62.0 /100 | #166 | Good 4.8% |
| Immigrants | Western Europe | 60.4 /100 | #167 | Good 4.8% |