Indian (Asian) vs Nigerian Unemployment Among Women with Children Ages 6 to 17 years
COMPARE
Indian (Asian)
Nigerian
Unemployment Among Women with Children Ages 6 to 17 years
Unemployment Among Women with Children Ages 6 to 17 years Comparison
Indians (Asian)
Nigerians
7.7%
UNEMPLOYMENT AMONG WOMEN WITH CHILDREN AGES 6 TO 17 YEARS
100.0/ 100
METRIC RATING
26th/ 347
METRIC RANK
10.1%
UNEMPLOYMENT AMONG WOMEN WITH CHILDREN AGES 6 TO 17 YEARS
0.0/ 100
METRIC RATING
300th/ 347
METRIC RANK
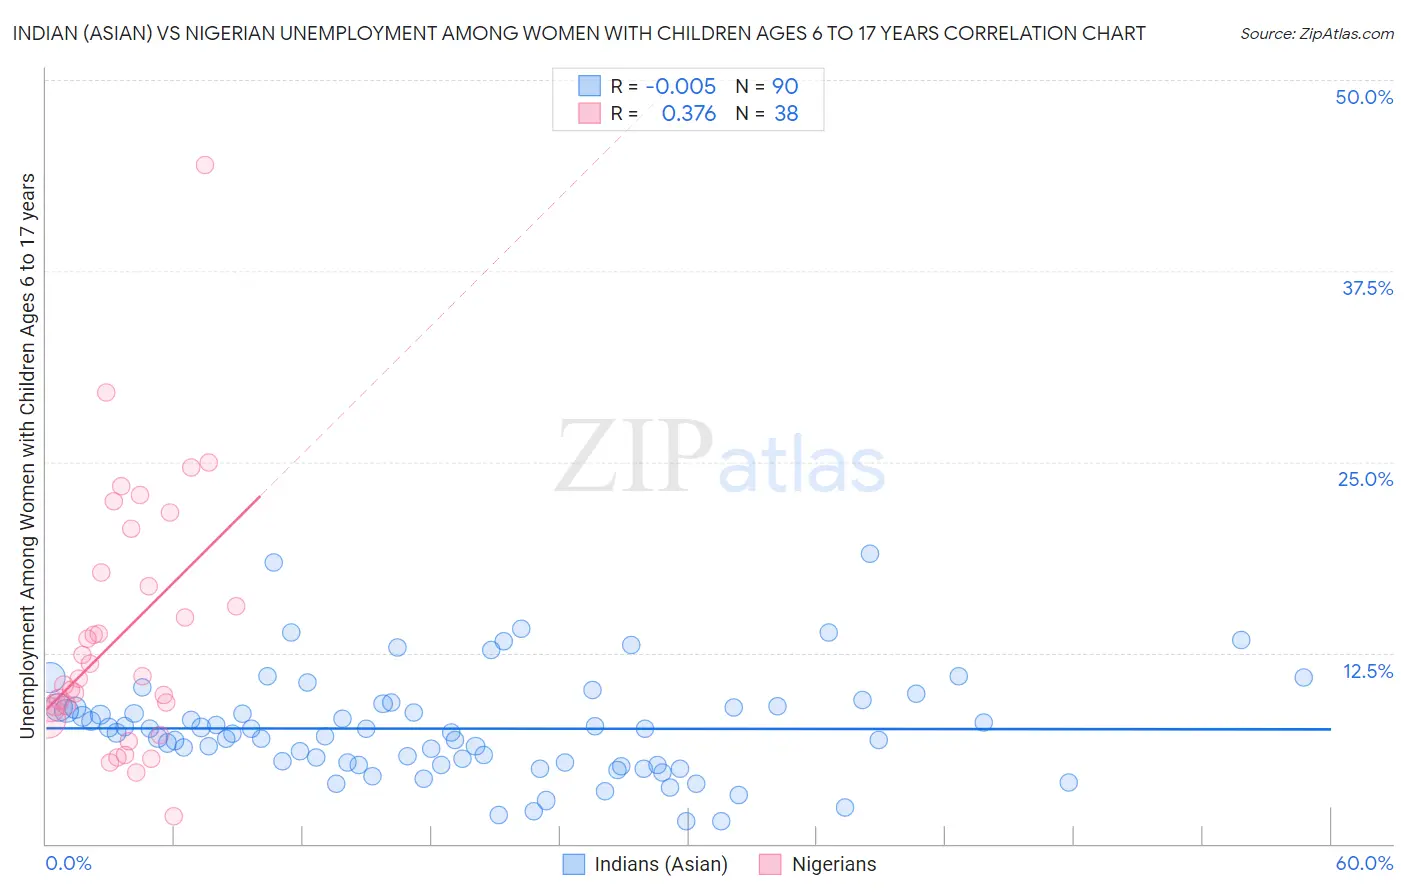
Indian (Asian) vs Nigerian Unemployment Among Women with Children Ages 6 to 17 years Correlation Chart
The statistical analysis conducted on geographies consisting of 335,697,712 people shows no correlation between the proportion of Indians (Asian) and unemployment rate among women with children between the ages 6 and 17 in the United States with a correlation coefficient (R) of -0.005 and weighted average of 7.7%. Similarly, the statistical analysis conducted on geographies consisting of 257,309,960 people shows a mild positive correlation between the proportion of Nigerians and unemployment rate among women with children between the ages 6 and 17 in the United States with a correlation coefficient (R) of 0.376 and weighted average of 10.1%, a difference of 30.7%.
Unemployment Among Women with Children Ages 6 to 17 years Correlation Summary
| Measurement | Indian (Asian) | Nigerian |
| Minimum | 1.5% | 1.8% |
| Maximum | 19.0% | 44.4% |
| Range | 17.5% | 42.6% |
| Mean | 7.5% | 13.8% |
| Median | 7.3% | 10.9% |
| Interquartile 25% (IQ1) | 5.2% | 8.8% |
| Interquartile 75% (IQ3) | 8.9% | 17.8% |
| Interquartile Range (IQR) | 3.7% | 9.0% |
| Standard Deviation (Sample) | 3.4% | 8.4% |
| Standard Deviation (Population) | 3.4% | 8.3% |
Similar Demographics by Unemployment Among Women with Children Ages 6 to 17 years
Demographics Similar to Indians (Asian) by Unemployment Among Women with Children Ages 6 to 17 years
In terms of unemployment among women with children ages 6 to 17 years, the demographic groups most similar to Indians (Asian) are Immigrants from Eastern Asia (7.7%, a difference of 0.010%), Immigrants from Indonesia (7.7%, a difference of 0.13%), Nepalese (7.7%, a difference of 0.13%), Immigrants from China (7.7%, a difference of 0.52%), and Immigrants from Afghanistan (7.8%, a difference of 0.63%).
| Demographics | Rating | Rank | Unemployment Among Women with Children Ages 6 to 17 years |
| Filipinos | 100.0 /100 | #19 | Exceptional 7.6% |
| Immigrants | Singapore | 100.0 /100 | #20 | Exceptional 7.7% |
| Immigrants | India | 100.0 /100 | #21 | Exceptional 7.7% |
| Immigrants | China | 100.0 /100 | #22 | Exceptional 7.7% |
| Immigrants | Indonesia | 100.0 /100 | #23 | Exceptional 7.7% |
| Nepalese | 100.0 /100 | #24 | Exceptional 7.7% |
| Immigrants | Eastern Asia | 100.0 /100 | #25 | Exceptional 7.7% |
| Indians (Asian) | 100.0 /100 | #26 | Exceptional 7.7% |
| Immigrants | Afghanistan | 100.0 /100 | #27 | Exceptional 7.8% |
| Immigrants | Uzbekistan | 100.0 /100 | #28 | Exceptional 7.8% |
| Thais | 100.0 /100 | #29 | Exceptional 7.8% |
| Immigrants | Iran | 100.0 /100 | #30 | Exceptional 7.9% |
| Laotians | 100.0 /100 | #31 | Exceptional 7.9% |
| Immigrants | Cambodia | 100.0 /100 | #32 | Exceptional 7.9% |
| Immigrants | Korea | 100.0 /100 | #33 | Exceptional 7.9% |
Demographics Similar to Nigerians by Unemployment Among Women with Children Ages 6 to 17 years
In terms of unemployment among women with children ages 6 to 17 years, the demographic groups most similar to Nigerians are Immigrants from Honduras (10.1%, a difference of 0.020%), Immigrants from Haiti (10.1%, a difference of 0.040%), Immigrants from Bahamas (10.1%, a difference of 0.15%), Immigrants from Caribbean (10.1%, a difference of 0.34%), and Immigrants from Western Africa (10.1%, a difference of 0.36%).
| Demographics | Rating | Rank | Unemployment Among Women with Children Ages 6 to 17 years |
| Haitians | 0.0 /100 | #293 | Tragic 10.0% |
| Ecuadorians | 0.0 /100 | #294 | Tragic 10.0% |
| Cherokee | 0.0 /100 | #295 | Tragic 10.0% |
| Immigrants | Western Africa | 0.0 /100 | #296 | Tragic 10.1% |
| Immigrants | Caribbean | 0.0 /100 | #297 | Tragic 10.1% |
| Immigrants | Haiti | 0.0 /100 | #298 | Tragic 10.1% |
| Immigrants | Honduras | 0.0 /100 | #299 | Tragic 10.1% |
| Nigerians | 0.0 /100 | #300 | Tragic 10.1% |
| Immigrants | Bahamas | 0.0 /100 | #301 | Tragic 10.1% |
| Venezuelans | 0.0 /100 | #302 | Tragic 10.2% |
| Immigrants | Ecuador | 0.0 /100 | #303 | Tragic 10.2% |
| Immigrants | Venezuela | 0.0 /100 | #304 | Tragic 10.2% |
| Immigrants | Nigeria | 0.0 /100 | #305 | Tragic 10.2% |
| Paraguayans | 0.0 /100 | #306 | Tragic 10.2% |
| Immigrants | Senegal | 0.0 /100 | #307 | Tragic 10.2% |