Indonesian vs Immigrants from Ethiopia Unemployment Among Women with Children Under 6 years
COMPARE
Indonesian
Immigrants from Ethiopia
Unemployment Among Women with Children Under 6 years
Unemployment Among Women with Children Under 6 years Comparison
Indonesians
Immigrants from Ethiopia
7.7%
UNEMPLOYMENT AMONG WOMEN WITH CHILDREN UNDER 6 YEARS
40.5/ 100
METRIC RATING
184th/ 347
METRIC RANK
6.9%
UNEMPLOYMENT AMONG WOMEN WITH CHILDREN UNDER 6 YEARS
99.8/ 100
METRIC RATING
56th/ 347
METRIC RANK
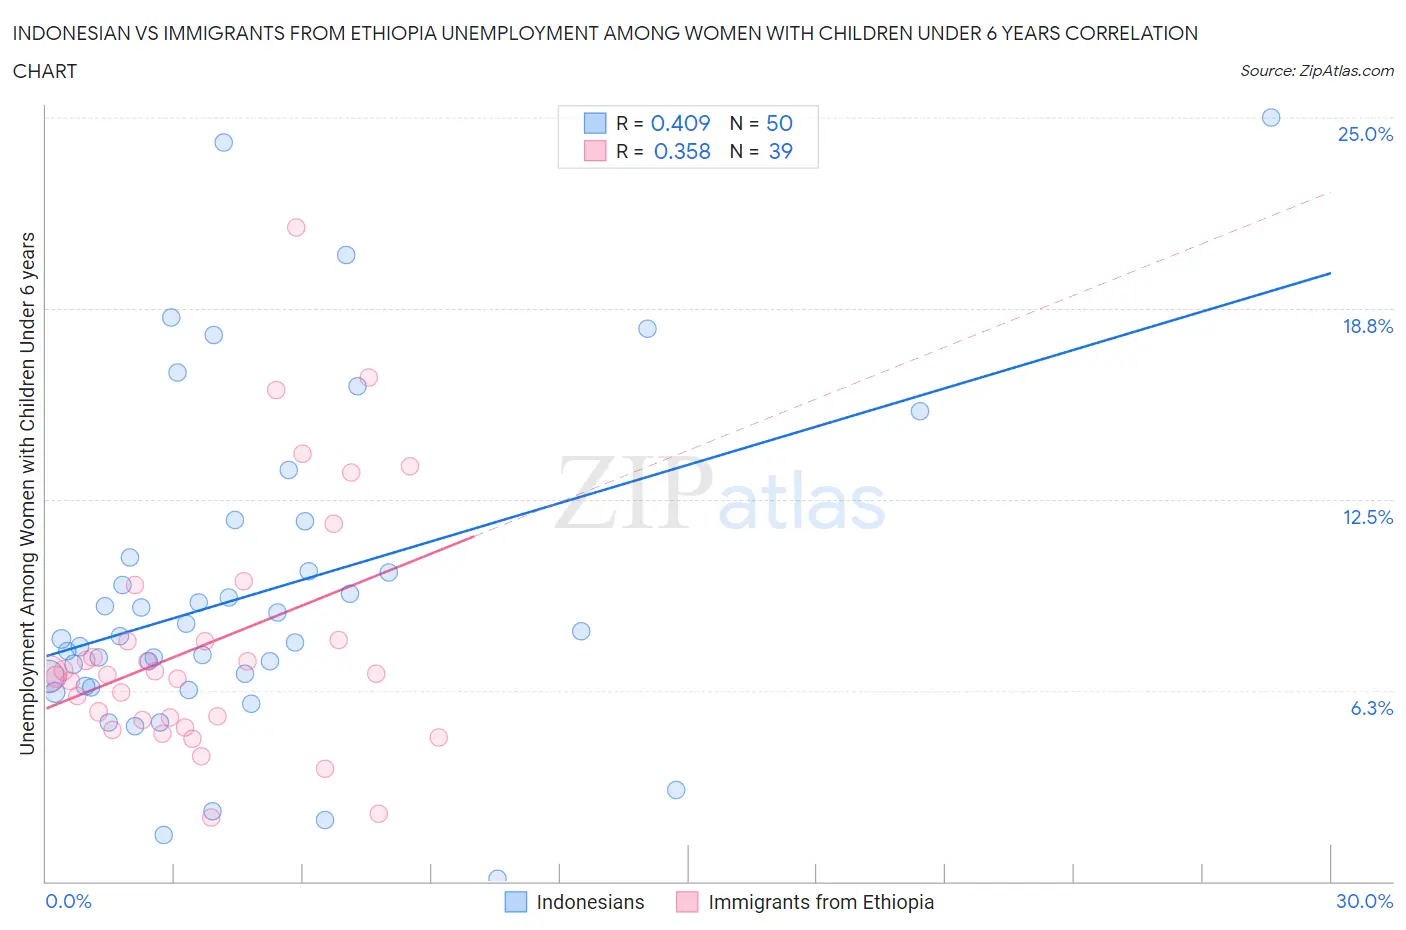
Indonesian vs Immigrants from Ethiopia Unemployment Among Women with Children Under 6 years Correlation Chart
The statistical analysis conducted on geographies consisting of 144,580,438 people shows a moderate positive correlation between the proportion of Indonesians and unemployment rate among women with children under the age of 6 in the United States with a correlation coefficient (R) of 0.409 and weighted average of 7.7%. Similarly, the statistical analysis conducted on geographies consisting of 180,200,424 people shows a mild positive correlation between the proportion of Immigrants from Ethiopia and unemployment rate among women with children under the age of 6 in the United States with a correlation coefficient (R) of 0.358 and weighted average of 6.9%, a difference of 12.3%.
Unemployment Among Women with Children Under 6 years Correlation Summary
| Measurement | Indonesian | Immigrants from Ethiopia |
| Minimum | 0.10% | 2.1% |
| Maximum | 25.0% | 21.4% |
| Range | 24.9% | 19.3% |
| Mean | 9.5% | 7.8% |
| Median | 8.0% | 6.8% |
| Interquartile 25% (IQ1) | 6.4% | 5.3% |
| Interquartile 75% (IQ3) | 10.6% | 7.9% |
| Interquartile Range (IQR) | 4.2% | 2.6% |
| Standard Deviation (Sample) | 5.4% | 4.1% |
| Standard Deviation (Population) | 5.4% | 4.0% |
Similar Demographics by Unemployment Among Women with Children Under 6 years
Demographics Similar to Indonesians by Unemployment Among Women with Children Under 6 years
In terms of unemployment among women with children under 6 years, the demographic groups most similar to Indonesians are Spanish American (7.7%, a difference of 0.060%), Yugoslavian (7.7%, a difference of 0.080%), Immigrants from Thailand (7.7%, a difference of 0.14%), Czechoslovakian (7.7%, a difference of 0.14%), and Sierra Leonean (7.7%, a difference of 0.16%).
| Demographics | Rating | Rank | Unemployment Among Women with Children Under 6 years |
| Austrians | 46.0 /100 | #177 | Average 7.7% |
| Immigrants | England | 45.4 /100 | #178 | Average 7.7% |
| Immigrants | Western Europe | 44.9 /100 | #179 | Average 7.7% |
| Immigrants | Uruguay | 44.5 /100 | #180 | Average 7.7% |
| Brazilians | 43.9 /100 | #181 | Average 7.7% |
| Nepalese | 43.5 /100 | #182 | Average 7.7% |
| Sierra Leoneans | 42.9 /100 | #183 | Average 7.7% |
| Indonesians | 40.5 /100 | #184 | Average 7.7% |
| Spanish Americans | 39.7 /100 | #185 | Fair 7.7% |
| Yugoslavians | 39.4 /100 | #186 | Fair 7.7% |
| Immigrants | Thailand | 38.5 /100 | #187 | Fair 7.7% |
| Czechoslovakians | 38.4 /100 | #188 | Fair 7.7% |
| Immigrants | Panama | 35.7 /100 | #189 | Fair 7.7% |
| Immigrants | North Macedonia | 34.4 /100 | #190 | Fair 7.7% |
| Immigrants | Austria | 32.4 /100 | #191 | Fair 7.7% |
Demographics Similar to Immigrants from Ethiopia by Unemployment Among Women with Children Under 6 years
In terms of unemployment among women with children under 6 years, the demographic groups most similar to Immigrants from Ethiopia are Icelander (6.9%, a difference of 0.010%), Immigrants from Ukraine (6.8%, a difference of 0.10%), Immigrants from Turkey (6.9%, a difference of 0.23%), Immigrants from Serbia (6.9%, a difference of 0.30%), and Immigrants from Sri Lanka (6.9%, a difference of 0.38%).
| Demographics | Rating | Rank | Unemployment Among Women with Children Under 6 years |
| Immigrants | Nepal | 99.9 /100 | #49 | Exceptional 6.8% |
| Immigrants | Ireland | 99.9 /100 | #50 | Exceptional 6.8% |
| Ethiopians | 99.9 /100 | #51 | Exceptional 6.8% |
| Immigrants | Iran | 99.9 /100 | #52 | Exceptional 6.8% |
| Chinese | 99.9 /100 | #53 | Exceptional 6.8% |
| Immigrants | Latvia | 99.9 /100 | #54 | Exceptional 6.8% |
| Immigrants | Ukraine | 99.8 /100 | #55 | Exceptional 6.8% |
| Immigrants | Ethiopia | 99.8 /100 | #56 | Exceptional 6.9% |
| Icelanders | 99.8 /100 | #57 | Exceptional 6.9% |
| Immigrants | Turkey | 99.8 /100 | #58 | Exceptional 6.9% |
| Immigrants | Serbia | 99.8 /100 | #59 | Exceptional 6.9% |
| Immigrants | Sri Lanka | 99.8 /100 | #60 | Exceptional 6.9% |
| Immigrants | France | 99.7 /100 | #61 | Exceptional 6.9% |
| Somalis | 99.7 /100 | #62 | Exceptional 6.9% |
| Maltese | 99.7 /100 | #63 | Exceptional 6.9% |