Indonesian vs Navajo Unemployment Among Ages 30 to 34 years
COMPARE
Indonesian
Navajo
Unemployment Among Ages 30 to 34 years
Unemployment Among Ages 30 to 34 years Comparison
Indonesians
Navajo
5.2%
UNEMPLOYMENT AMONG AGES 30 TO 34 YEARS
95.1/ 100
METRIC RATING
78th/ 347
METRIC RANK
10.6%
UNEMPLOYMENT AMONG AGES 30 TO 34 YEARS
0.0/ 100
METRIC RATING
341st/ 347
METRIC RANK
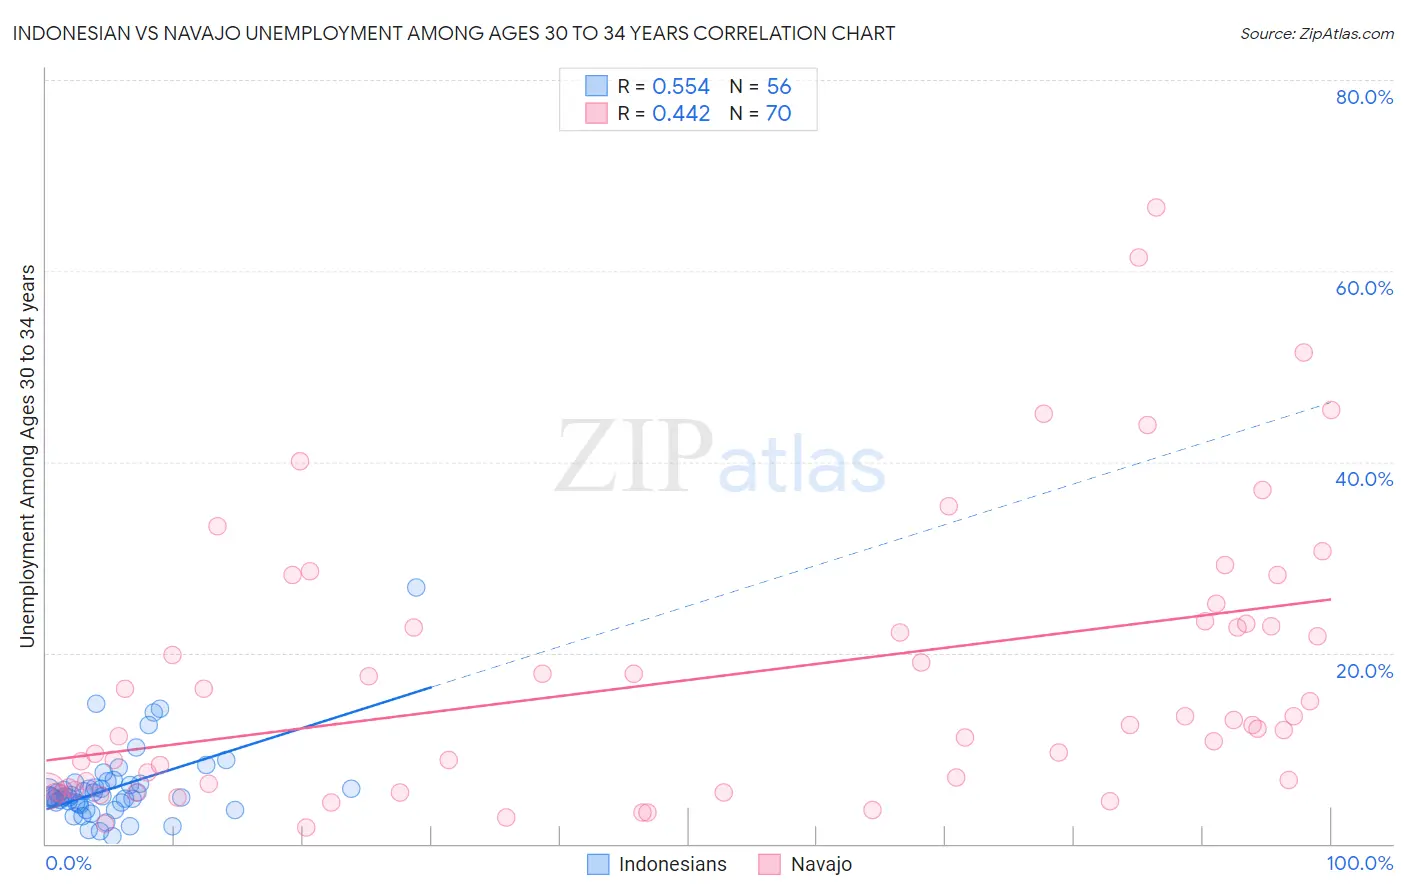
Indonesian vs Navajo Unemployment Among Ages 30 to 34 years Correlation Chart
The statistical analysis conducted on geographies consisting of 159,189,213 people shows a substantial positive correlation between the proportion of Indonesians and unemployment rate among population between the ages 30 and 34 in the United States with a correlation coefficient (R) of 0.554 and weighted average of 5.2%. Similarly, the statistical analysis conducted on geographies consisting of 217,031,350 people shows a moderate positive correlation between the proportion of Navajo and unemployment rate among population between the ages 30 and 34 in the United States with a correlation coefficient (R) of 0.442 and weighted average of 10.6%, a difference of 103.7%.
Unemployment Among Ages 30 to 34 years Correlation Summary
| Measurement | Indonesian | Navajo |
| Minimum | 0.80% | 1.7% |
| Maximum | 26.8% | 66.7% |
| Range | 26.0% | 65.0% |
| Mean | 5.9% | 17.4% |
| Median | 5.0% | 12.5% |
| Interquartile 25% (IQ1) | 4.2% | 5.9% |
| Interquartile 75% (IQ3) | 6.2% | 23.1% |
| Interquartile Range (IQR) | 2.0% | 17.2% |
| Standard Deviation (Sample) | 4.1% | 14.5% |
| Standard Deviation (Population) | 4.0% | 14.4% |
Similar Demographics by Unemployment Among Ages 30 to 34 years
Demographics Similar to Indonesians by Unemployment Among Ages 30 to 34 years
In terms of unemployment among ages 30 to 34 years, the demographic groups most similar to Indonesians are Immigrants from Lithuania (5.2%, a difference of 0.050%), Uruguayan (5.2%, a difference of 0.13%), Immigrants from Indonesia (5.2%, a difference of 0.15%), Scandinavian (5.2%, a difference of 0.20%), and Chilean (5.2%, a difference of 0.25%).
| Demographics | Rating | Rank | Unemployment Among Ages 30 to 34 years |
| Paraguayans | 96.4 /100 | #71 | Exceptional 5.1% |
| Immigrants | Moldova | 96.4 /100 | #72 | Exceptional 5.1% |
| Slovenes | 96.2 /100 | #73 | Exceptional 5.2% |
| Immigrants | Asia | 96.2 /100 | #74 | Exceptional 5.2% |
| Iranians | 96.0 /100 | #75 | Exceptional 5.2% |
| Scandinavians | 95.6 /100 | #76 | Exceptional 5.2% |
| Uruguayans | 95.4 /100 | #77 | Exceptional 5.2% |
| Indonesians | 95.1 /100 | #78 | Exceptional 5.2% |
| Immigrants | Lithuania | 95.0 /100 | #79 | Exceptional 5.2% |
| Immigrants | Indonesia | 94.7 /100 | #80 | Exceptional 5.2% |
| Chileans | 94.4 /100 | #81 | Exceptional 5.2% |
| Immigrants | Latvia | 94.2 /100 | #82 | Exceptional 5.2% |
| Immigrants | Korea | 94.1 /100 | #83 | Exceptional 5.2% |
| Immigrants | Uganda | 94.0 /100 | #84 | Exceptional 5.2% |
| Immigrants | Egypt | 93.9 /100 | #85 | Exceptional 5.2% |
Demographics Similar to Navajo by Unemployment Among Ages 30 to 34 years
In terms of unemployment among ages 30 to 34 years, the demographic groups most similar to Navajo are Yuman (10.6%, a difference of 0.40%), Crow (10.3%, a difference of 2.0%), Inupiat (10.8%, a difference of 2.5%), Tohono O'odham (9.8%, a difference of 7.3%), and Yakama (9.8%, a difference of 8.1%).
| Demographics | Rating | Rank | Unemployment Among Ages 30 to 34 years |
| Pueblo | 0.0 /100 | #333 | Tragic 8.3% |
| Alaska Natives | 0.0 /100 | #334 | Tragic 8.5% |
| Puerto Ricans | 0.0 /100 | #335 | Tragic 8.9% |
| Colville | 0.0 /100 | #336 | Tragic 9.0% |
| Pima | 0.0 /100 | #337 | Tragic 9.6% |
| Yakama | 0.0 /100 | #338 | Tragic 9.8% |
| Tohono O'odham | 0.0 /100 | #339 | Tragic 9.8% |
| Crow | 0.0 /100 | #340 | Tragic 10.3% |
| Navajo | 0.0 /100 | #341 | Tragic 10.6% |
| Yuman | 0.0 /100 | #342 | Tragic 10.6% |
| Inupiat | 0.0 /100 | #343 | Tragic 10.8% |
| Hopi | 0.0 /100 | #344 | Tragic 11.9% |
| Arapaho | 0.0 /100 | #345 | Tragic 12.8% |
| Tsimshian | 0.0 /100 | #346 | Tragic 13.8% |
| Yup'ik | 0.0 /100 | #347 | Tragic 18.5% |