Korean vs Cypriot Unemployment Among Ages 30 to 34 years
COMPARE
Korean
Cypriot
Unemployment Among Ages 30 to 34 years
Unemployment Among Ages 30 to 34 years Comparison
Koreans
Cypriots
5.6%
UNEMPLOYMENT AMONG AGES 30 TO 34 YEARS
20.7/ 100
METRIC RATING
203rd/ 347
METRIC RANK
5.1%
UNEMPLOYMENT AMONG AGES 30 TO 34 YEARS
98.4/ 100
METRIC RATING
47th/ 347
METRIC RANK
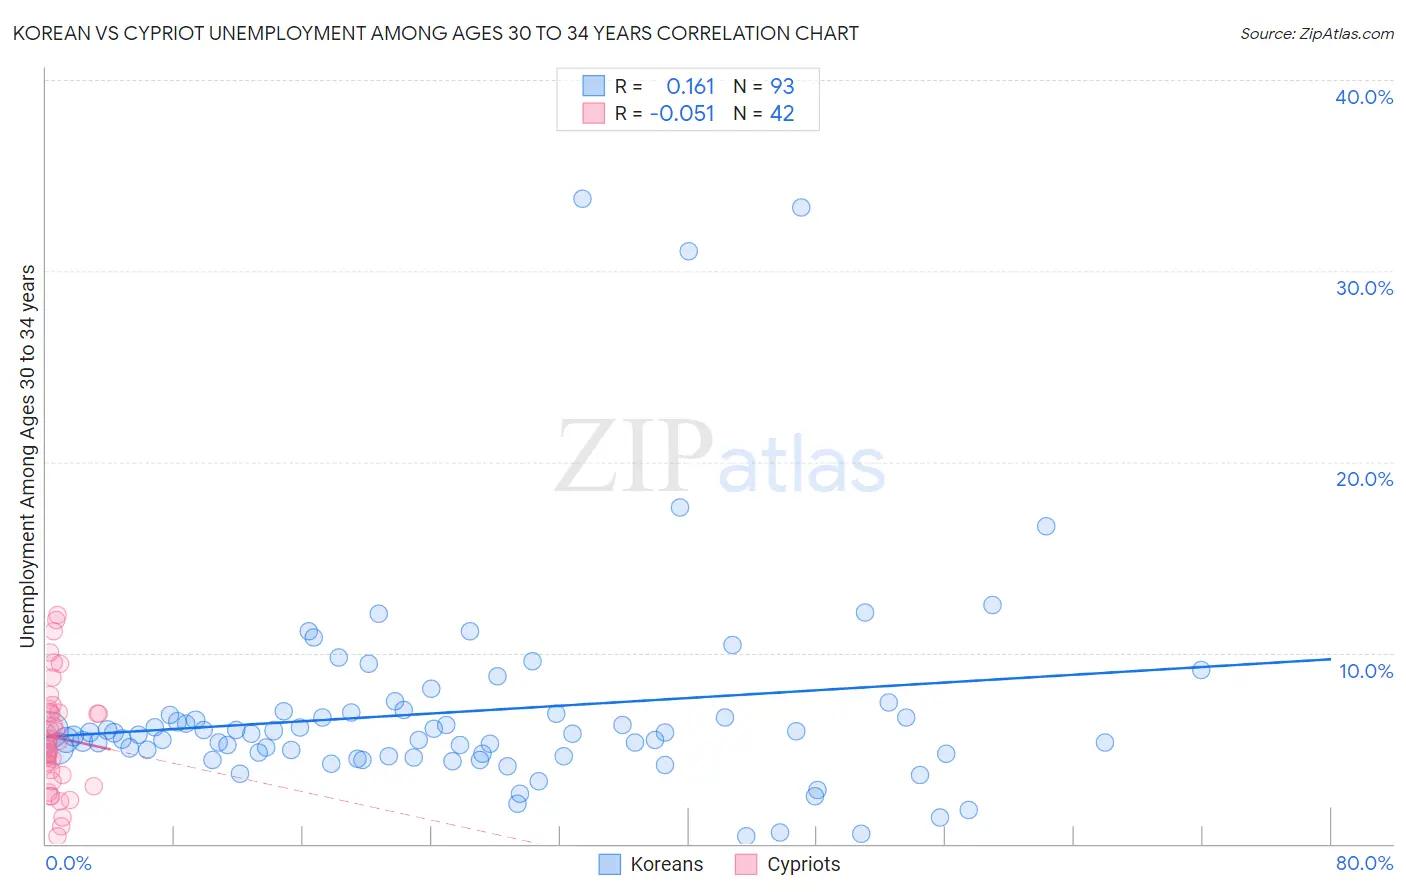
Korean vs Cypriot Unemployment Among Ages 30 to 34 years Correlation Chart
The statistical analysis conducted on geographies consisting of 466,228,807 people shows a poor positive correlation between the proportion of Koreans and unemployment rate among population between the ages 30 and 34 in the United States with a correlation coefficient (R) of 0.161 and weighted average of 5.6%. Similarly, the statistical analysis conducted on geographies consisting of 61,053,204 people shows a slight negative correlation between the proportion of Cypriots and unemployment rate among population between the ages 30 and 34 in the United States with a correlation coefficient (R) of -0.051 and weighted average of 5.1%, a difference of 10.2%.
Unemployment Among Ages 30 to 34 years Correlation Summary
| Measurement | Korean | Cypriot |
| Minimum | 0.40% | 0.40% |
| Maximum | 33.8% | 12.0% |
| Range | 33.4% | 11.6% |
| Mean | 6.9% | 5.6% |
| Median | 5.8% | 5.3% |
| Interquartile 25% (IQ1) | 4.6% | 3.6% |
| Interquartile 75% (IQ3) | 6.8% | 6.9% |
| Interquartile Range (IQR) | 2.2% | 3.3% |
| Standard Deviation (Sample) | 5.6% | 2.8% |
| Standard Deviation (Population) | 5.5% | 2.8% |
Similar Demographics by Unemployment Among Ages 30 to 34 years
Demographics Similar to Koreans by Unemployment Among Ages 30 to 34 years
In terms of unemployment among ages 30 to 34 years, the demographic groups most similar to Koreans are Immigrants from Germany (5.6%, a difference of 0.22%), Immigrants from Cameroon (5.6%, a difference of 0.25%), South American Indian (5.6%, a difference of 0.36%), Immigrants from Southern Europe (5.6%, a difference of 0.49%), and Nicaraguan (5.6%, a difference of 0.56%).
| Demographics | Rating | Rank | Unemployment Among Ages 30 to 34 years |
| Immigrants | South America | 29.8 /100 | #196 | Fair 5.5% |
| Immigrants | Nicaragua | 28.9 /100 | #197 | Fair 5.5% |
| Immigrants | Afghanistan | 27.2 /100 | #198 | Fair 5.6% |
| Nicaraguans | 26.6 /100 | #199 | Fair 5.6% |
| Immigrants | Southern Europe | 25.8 /100 | #200 | Fair 5.6% |
| South American Indians | 24.4 /100 | #201 | Fair 5.6% |
| Immigrants | Germany | 22.9 /100 | #202 | Fair 5.6% |
| Koreans | 20.7 /100 | #203 | Fair 5.6% |
| Immigrants | Cameroon | 18.4 /100 | #204 | Poor 5.6% |
| Immigrants | Costa Rica | 14.4 /100 | #205 | Poor 5.6% |
| Alsatians | 14.3 /100 | #206 | Poor 5.6% |
| Israelis | 12.8 /100 | #207 | Poor 5.6% |
| Immigrants | Philippines | 11.5 /100 | #208 | Poor 5.7% |
| French | 10.8 /100 | #209 | Poor 5.7% |
| Whites/Caucasians | 9.2 /100 | #210 | Tragic 5.7% |
Demographics Similar to Cypriots by Unemployment Among Ages 30 to 34 years
In terms of unemployment among ages 30 to 34 years, the demographic groups most similar to Cypriots are Assyrian/Chaldean/Syriac (5.1%, a difference of 0.020%), Immigrants from Congo (5.1%, a difference of 0.030%), Immigrants from Malaysia (5.1%, a difference of 0.14%), Puget Sound Salish (5.1%, a difference of 0.21%), and Turkish (5.1%, a difference of 0.25%).
| Demographics | Rating | Rank | Unemployment Among Ages 30 to 34 years |
| Immigrants | Vietnam | 98.9 /100 | #40 | Exceptional 5.0% |
| Immigrants | Eastern Africa | 98.9 /100 | #41 | Exceptional 5.0% |
| Immigrants | Hong Kong | 98.8 /100 | #42 | Exceptional 5.0% |
| Soviet Union | 98.8 /100 | #43 | Exceptional 5.0% |
| Immigrants | Belgium | 98.7 /100 | #44 | Exceptional 5.1% |
| Yugoslavians | 98.6 /100 | #45 | Exceptional 5.1% |
| Immigrants | Congo | 98.4 /100 | #46 | Exceptional 5.1% |
| Cypriots | 98.4 /100 | #47 | Exceptional 5.1% |
| Assyrians/Chaldeans/Syriacs | 98.4 /100 | #48 | Exceptional 5.1% |
| Immigrants | Malaysia | 98.3 /100 | #49 | Exceptional 5.1% |
| Puget Sound Salish | 98.2 /100 | #50 | Exceptional 5.1% |
| Turks | 98.2 /100 | #51 | Exceptional 5.1% |
| Immigrants | Burma/Myanmar | 98.1 /100 | #52 | Exceptional 5.1% |
| Cubans | 98.1 /100 | #53 | Exceptional 5.1% |
| Immigrants | Morocco | 97.9 /100 | #54 | Exceptional 5.1% |