Mexican vs Immigrants from Congo Unemployment Among Women with Children Under 6 years
COMPARE
Mexican
Immigrants from Congo
Unemployment Among Women with Children Under 6 years
Unemployment Among Women with Children Under 6 years Comparison
Mexicans
Immigrants from Congo
8.9%
UNEMPLOYMENT AMONG WOMEN WITH CHILDREN UNDER 6 YEARS
0.0/ 100
METRIC RATING
297th/ 347
METRIC RANK
8.5%
UNEMPLOYMENT AMONG WOMEN WITH CHILDREN UNDER 6 YEARS
0.2/ 100
METRIC RATING
271st/ 347
METRIC RANK
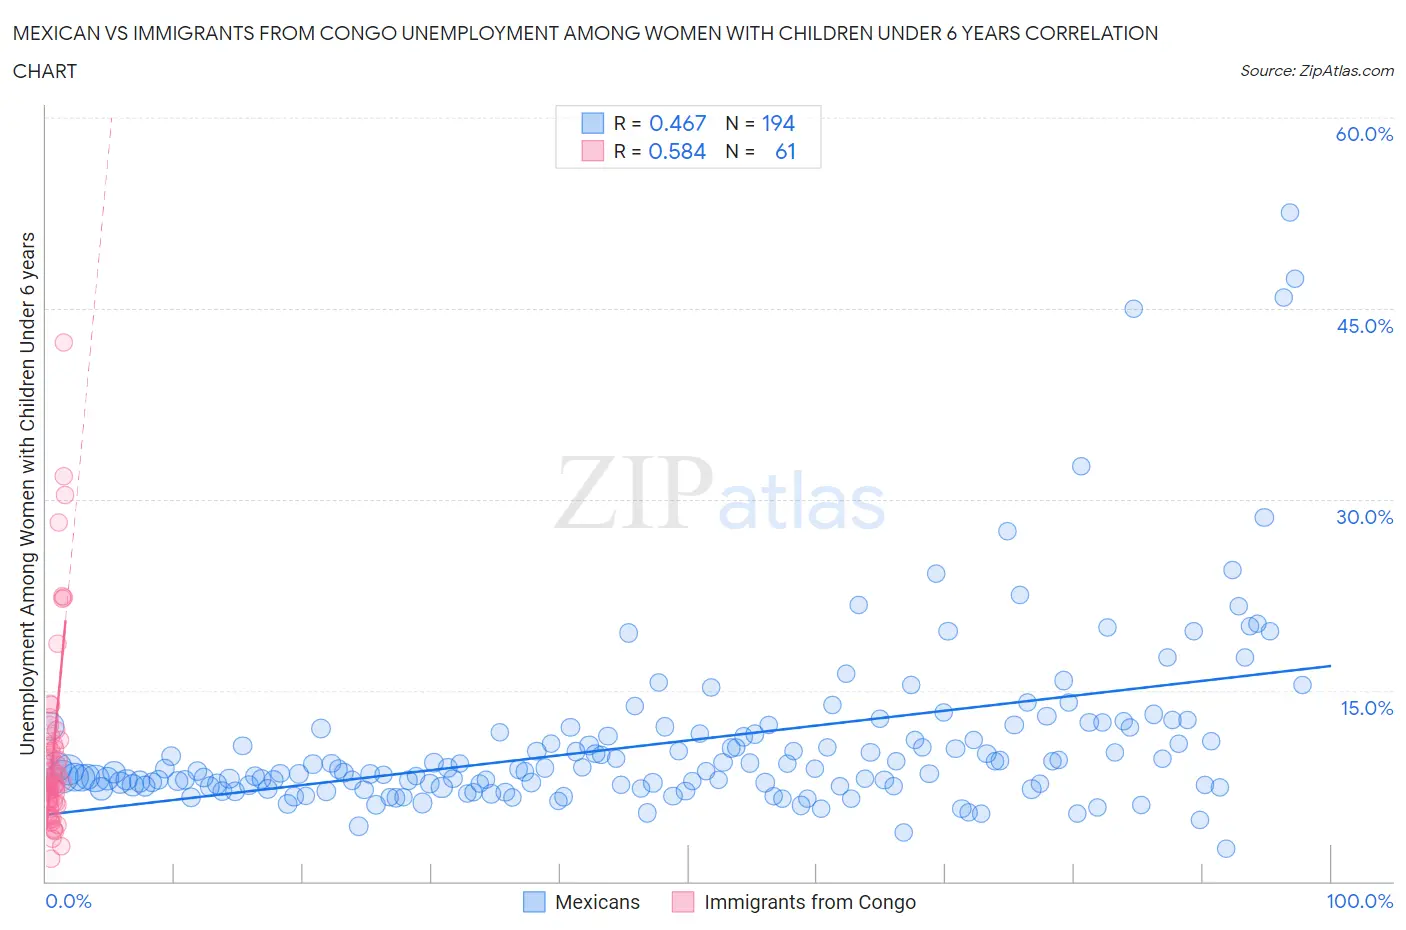
Mexican vs Immigrants from Congo Unemployment Among Women with Children Under 6 years Correlation Chart
The statistical analysis conducted on geographies consisting of 378,149,944 people shows a moderate positive correlation between the proportion of Mexicans and unemployment rate among women with children under the age of 6 in the United States with a correlation coefficient (R) of 0.467 and weighted average of 8.9%. Similarly, the statistical analysis conducted on geographies consisting of 85,861,208 people shows a substantial positive correlation between the proportion of Immigrants from Congo and unemployment rate among women with children under the age of 6 in the United States with a correlation coefficient (R) of 0.584 and weighted average of 8.5%, a difference of 4.8%.
Unemployment Among Women with Children Under 6 years Correlation Summary
| Measurement | Mexican | Immigrants from Congo |
| Minimum | 2.6% | 1.8% |
| Maximum | 52.5% | 42.3% |
| Range | 49.9% | 40.5% |
| Mean | 10.9% | 10.2% |
| Median | 8.7% | 7.8% |
| Interquartile 25% (IQ1) | 7.5% | 6.2% |
| Interquartile 75% (IQ3) | 11.6% | 11.0% |
| Interquartile Range (IQR) | 4.1% | 4.8% |
| Standard Deviation (Sample) | 7.1% | 7.6% |
| Standard Deviation (Population) | 7.0% | 7.6% |
Similar Demographics by Unemployment Among Women with Children Under 6 years
Demographics Similar to Mexicans by Unemployment Among Women with Children Under 6 years
In terms of unemployment among women with children under 6 years, the demographic groups most similar to Mexicans are Immigrants from Dominican Republic (8.9%, a difference of 0.10%), Tlingit-Haida (8.9%, a difference of 0.16%), Immigrants from Central America (8.9%, a difference of 0.23%), Nonimmigrants (8.8%, a difference of 0.27%), and Immigrants from Jamaica (8.9%, a difference of 0.37%).
| Demographics | Rating | Rank | Unemployment Among Women with Children Under 6 years |
| Vietnamese | 0.0 /100 | #290 | Tragic 8.8% |
| Jamaicans | 0.0 /100 | #291 | Tragic 8.8% |
| Cheyenne | 0.0 /100 | #292 | Tragic 8.8% |
| Immigrants | Bangladesh | 0.0 /100 | #293 | Tragic 8.8% |
| Immigrants | Nonimmigrants | 0.0 /100 | #294 | Tragic 8.8% |
| Immigrants | Central America | 0.0 /100 | #295 | Tragic 8.9% |
| Immigrants | Dominican Republic | 0.0 /100 | #296 | Tragic 8.9% |
| Mexicans | 0.0 /100 | #297 | Tragic 8.9% |
| Tlingit-Haida | 0.0 /100 | #298 | Tragic 8.9% |
| Immigrants | Jamaica | 0.0 /100 | #299 | Tragic 8.9% |
| Creek | 0.0 /100 | #300 | Tragic 8.9% |
| Chickasaw | 0.0 /100 | #301 | Tragic 9.0% |
| Hispanics or Latinos | 0.0 /100 | #302 | Tragic 9.0% |
| Immigrants | West Indies | 0.0 /100 | #303 | Tragic 9.0% |
| Immigrants | Mexico | 0.0 /100 | #304 | Tragic 9.1% |
Demographics Similar to Immigrants from Congo by Unemployment Among Women with Children Under 6 years
In terms of unemployment among women with children under 6 years, the demographic groups most similar to Immigrants from Congo are Immigrants from Senegal (8.5%, a difference of 0.010%), Immigrants from Haiti (8.4%, a difference of 0.35%), Subsaharan African (8.4%, a difference of 0.43%), Belizean (8.4%, a difference of 0.54%), and Mexican American Indian (8.5%, a difference of 0.56%).
| Demographics | Rating | Rank | Unemployment Among Women with Children Under 6 years |
| Hondurans | 0.3 /100 | #264 | Tragic 8.4% |
| French Canadians | 0.3 /100 | #265 | Tragic 8.4% |
| Immigrants | Honduras | 0.3 /100 | #266 | Tragic 8.4% |
| Belizeans | 0.2 /100 | #267 | Tragic 8.4% |
| Sub-Saharan Africans | 0.2 /100 | #268 | Tragic 8.4% |
| Immigrants | Haiti | 0.2 /100 | #269 | Tragic 8.4% |
| Immigrants | Senegal | 0.2 /100 | #270 | Tragic 8.5% |
| Immigrants | Congo | 0.2 /100 | #271 | Tragic 8.5% |
| Mexican American Indians | 0.1 /100 | #272 | Tragic 8.5% |
| Slovaks | 0.1 /100 | #273 | Tragic 8.5% |
| Immigrants | Cameroon | 0.1 /100 | #274 | Tragic 8.6% |
| Immigrants | Latin America | 0.1 /100 | #275 | Tragic 8.6% |
| Yaqui | 0.0 /100 | #276 | Tragic 8.6% |
| Haitians | 0.0 /100 | #277 | Tragic 8.6% |
| Immigrants | Dominica | 0.0 /100 | #278 | Tragic 8.6% |