Mongolian vs Immigrants from Congo Unemployment Among Ages 55 to 59 years
COMPARE
Mongolian
Immigrants from Congo
Unemployment Among Ages 55 to 59 years
Unemployment Among Ages 55 to 59 years Comparison
Mongolians
Immigrants from Congo
4.6%
UNEMPLOYMENT AMONG AGES 55 TO 59 YEARS
99.0/ 100
METRIC RATING
66th/ 347
METRIC RANK
4.3%
UNEMPLOYMENT AMONG AGES 55 TO 59 YEARS
100.0/ 100
METRIC RATING
11th/ 347
METRIC RANK
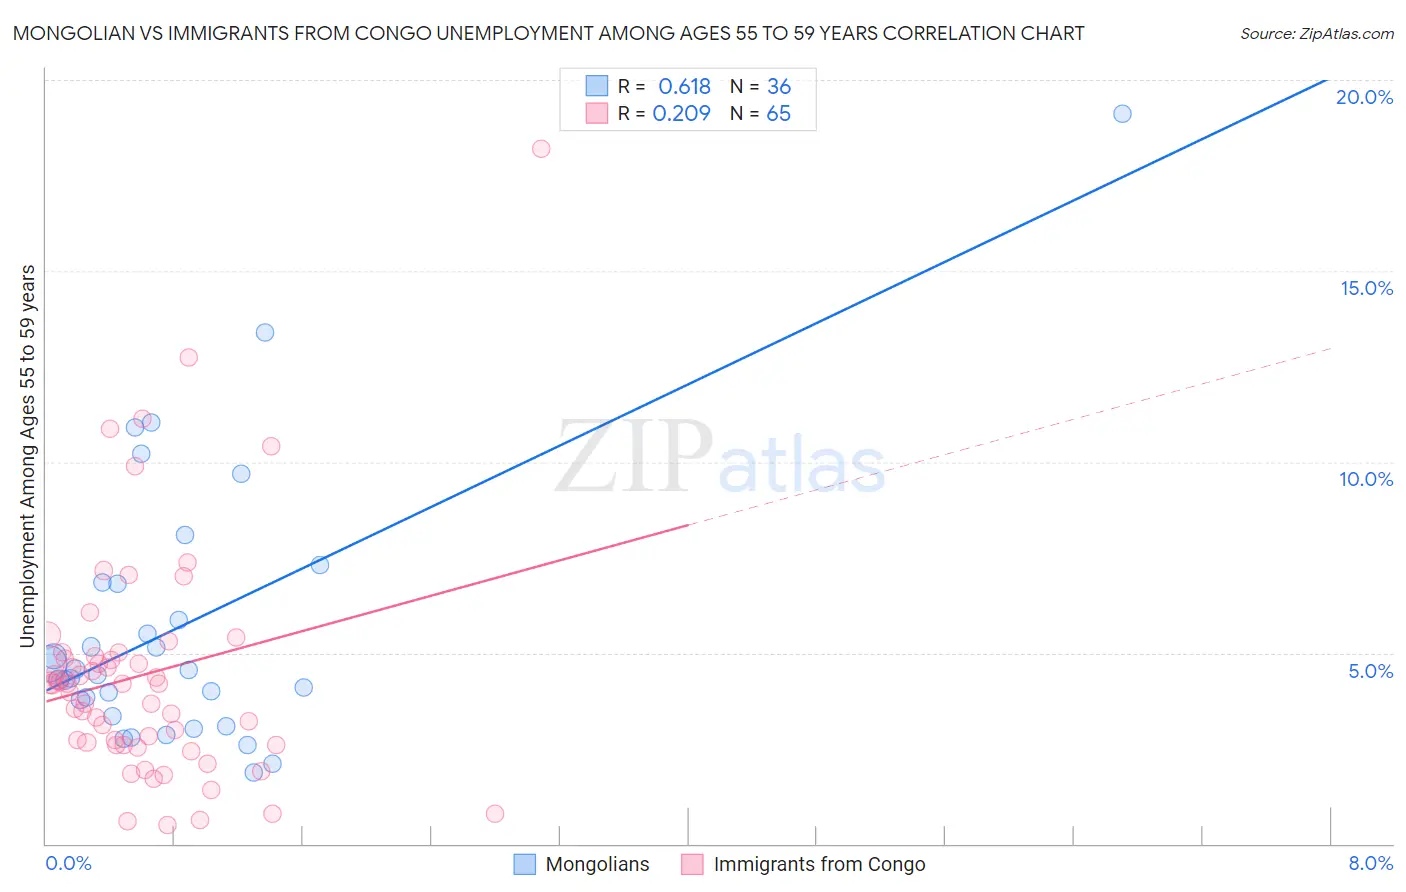
Mongolian vs Immigrants from Congo Unemployment Among Ages 55 to 59 years Correlation Chart
The statistical analysis conducted on geographies consisting of 137,147,690 people shows a significant positive correlation between the proportion of Mongolians and unemployment rate among population between the ages 55 and 59 in the United States with a correlation coefficient (R) of 0.618 and weighted average of 4.6%. Similarly, the statistical analysis conducted on geographies consisting of 90,603,220 people shows a weak positive correlation between the proportion of Immigrants from Congo and unemployment rate among population between the ages 55 and 59 in the United States with a correlation coefficient (R) of 0.209 and weighted average of 4.3%, a difference of 6.7%.
Unemployment Among Ages 55 to 59 years Correlation Summary
| Measurement | Mongolian | Immigrants from Congo |
| Minimum | 1.9% | 0.50% |
| Maximum | 19.1% | 18.2% |
| Range | 17.2% | 17.7% |
| Mean | 5.7% | 4.4% |
| Median | 4.5% | 4.2% |
| Interquartile 25% (IQ1) | 3.6% | 2.6% |
| Interquartile 75% (IQ3) | 6.8% | 5.0% |
| Interquartile Range (IQR) | 3.3% | 2.4% |
| Standard Deviation (Sample) | 3.6% | 3.1% |
| Standard Deviation (Population) | 3.5% | 3.1% |
Similar Demographics by Unemployment Among Ages 55 to 59 years
Demographics Similar to Mongolians by Unemployment Among Ages 55 to 59 years
In terms of unemployment among ages 55 to 59 years, the demographic groups most similar to Mongolians are Ugandan (4.6%, a difference of 0.040%), Immigrants from Micronesia (4.6%, a difference of 0.050%), Czechoslovakian (4.6%, a difference of 0.060%), Argentinean (4.6%, a difference of 0.14%), and Sudanese (4.6%, a difference of 0.14%).
| Demographics | Rating | Rank | Unemployment Among Ages 55 to 59 years |
| Immigrants | Uganda | 99.5 /100 | #59 | Exceptional 4.6% |
| Dutch | 99.5 /100 | #60 | Exceptional 4.6% |
| Immigrants | Argentina | 99.5 /100 | #61 | Exceptional 4.6% |
| Slovenes | 99.3 /100 | #62 | Exceptional 4.6% |
| Immigrants | South Central Asia | 99.3 /100 | #63 | Exceptional 4.6% |
| Argentineans | 99.1 /100 | #64 | Exceptional 4.6% |
| Sudanese | 99.1 /100 | #65 | Exceptional 4.6% |
| Mongolians | 99.0 /100 | #66 | Exceptional 4.6% |
| Ugandans | 99.0 /100 | #67 | Exceptional 4.6% |
| Immigrants | Micronesia | 99.0 /100 | #68 | Exceptional 4.6% |
| Czechoslovakians | 99.0 /100 | #69 | Exceptional 4.6% |
| Filipinos | 98.8 /100 | #70 | Exceptional 4.6% |
| Immigrants | Jordan | 98.7 /100 | #71 | Exceptional 4.6% |
| Immigrants | Taiwan | 98.7 /100 | #72 | Exceptional 4.6% |
| Bhutanese | 98.6 /100 | #73 | Exceptional 4.6% |
Demographics Similar to Immigrants from Congo by Unemployment Among Ages 55 to 59 years
In terms of unemployment among ages 55 to 59 years, the demographic groups most similar to Immigrants from Congo are Danish (4.3%, a difference of 0.19%), Indonesian (4.3%, a difference of 0.45%), Tongan (4.3%, a difference of 0.51%), Immigrants from India (4.3%, a difference of 0.61%), and Bulgarian (4.3%, a difference of 0.87%).
| Demographics | Rating | Rank | Unemployment Among Ages 55 to 59 years |
| Venezuelans | 100.0 /100 | #4 | Exceptional 4.2% |
| Immigrants | Bolivia | 100.0 /100 | #5 | Exceptional 4.2% |
| Norwegians | 100.0 /100 | #6 | Exceptional 4.2% |
| Zimbabweans | 100.0 /100 | #7 | Exceptional 4.2% |
| Bolivians | 100.0 /100 | #8 | Exceptional 4.2% |
| Cubans | 100.0 /100 | #9 | Exceptional 4.2% |
| Tongans | 100.0 /100 | #10 | Exceptional 4.3% |
| Immigrants | Congo | 100.0 /100 | #11 | Exceptional 4.3% |
| Danes | 100.0 /100 | #12 | Exceptional 4.3% |
| Indonesians | 100.0 /100 | #13 | Exceptional 4.3% |
| Immigrants | India | 100.0 /100 | #14 | Exceptional 4.3% |
| Bulgarians | 100.0 /100 | #15 | Exceptional 4.3% |
| Somalis | 100.0 /100 | #16 | Exceptional 4.4% |
| Czechs | 100.0 /100 | #17 | Exceptional 4.4% |
| Immigrants | Somalia | 100.0 /100 | #18 | Exceptional 4.4% |