Mongolian vs Immigrants from France Unemployment
COMPARE
Mongolian
Immigrants from France
Unemployment
Unemployment Comparison
Mongolians
Immigrants from France
5.0%
UNEMPLOYMENT
94.8/ 100
METRIC RATING
99th/ 347
METRIC RANK
5.1%
UNEMPLOYMENT
89.7/ 100
METRIC RATING
119th/ 347
METRIC RANK
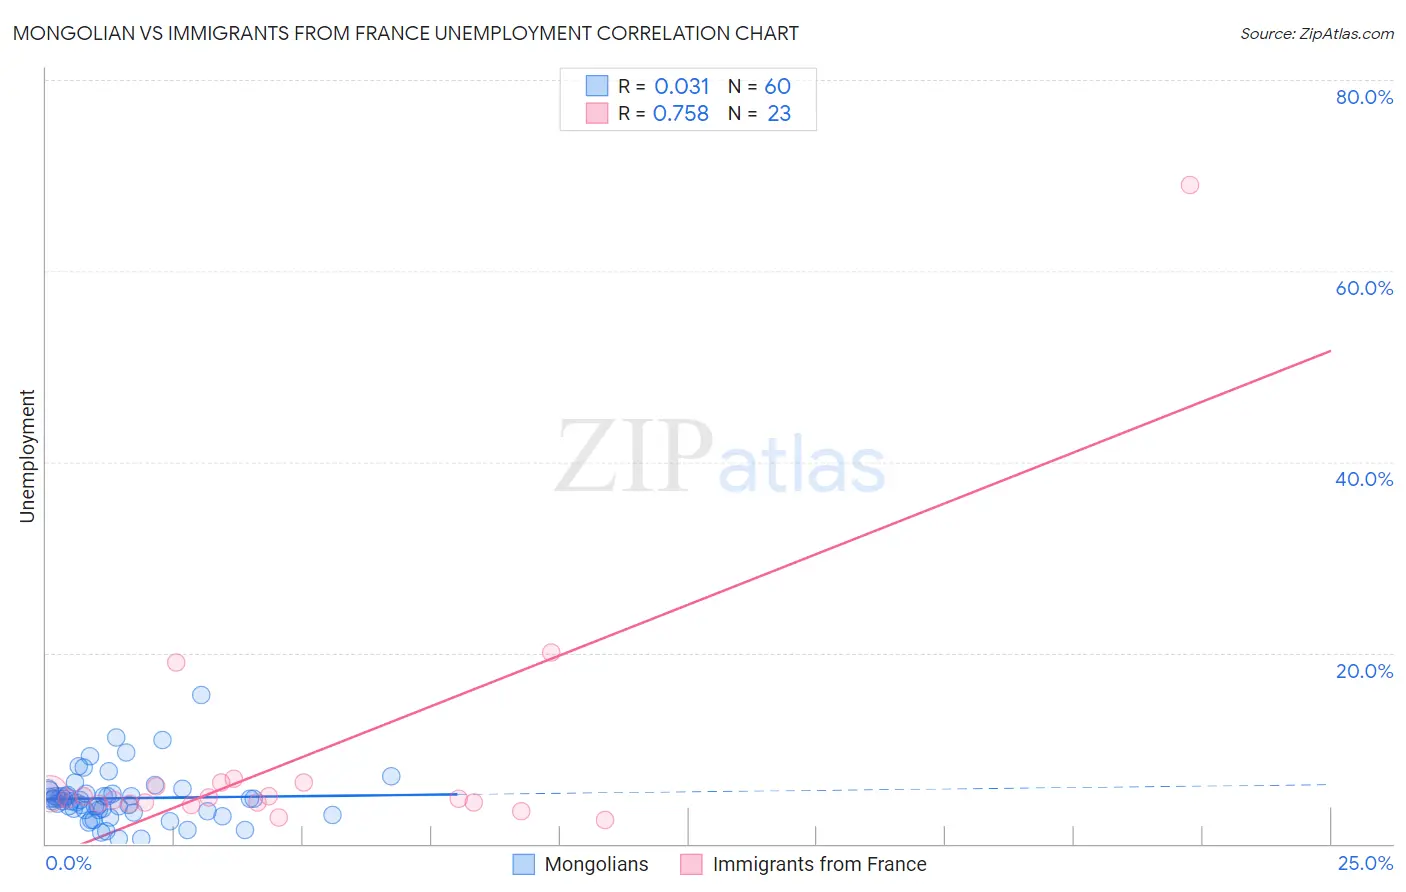
Mongolian vs Immigrants from France Unemployment Correlation Chart
The statistical analysis conducted on geographies consisting of 140,354,726 people shows no correlation between the proportion of Mongolians and unemployment in the United States with a correlation coefficient (R) of 0.031 and weighted average of 5.0%. Similarly, the statistical analysis conducted on geographies consisting of 287,750,590 people shows a strong positive correlation between the proportion of Immigrants from France and unemployment in the United States with a correlation coefficient (R) of 0.758 and weighted average of 5.1%, a difference of 1.2%.
Unemployment Correlation Summary
| Measurement | Mongolian | Immigrants from France |
| Minimum | 0.50% | 2.5% |
| Maximum | 15.6% | 69.0% |
| Range | 15.1% | 66.5% |
| Mean | 4.8% | 8.8% |
| Median | 4.6% | 4.7% |
| Interquartile 25% (IQ1) | 3.5% | 4.2% |
| Interquartile 75% (IQ3) | 5.3% | 6.4% |
| Interquartile Range (IQR) | 1.8% | 2.2% |
| Standard Deviation (Sample) | 2.6% | 13.8% |
| Standard Deviation (Population) | 2.6% | 13.5% |
Demographics Similar to Mongolians and Immigrants from France by Unemployment
In terms of unemployment, the demographic groups most similar to Mongolians are Estonian (5.0%, a difference of 0.060%), American (5.0%, a difference of 0.15%), Immigrants from Argentina (5.0%, a difference of 0.20%), Chickasaw (5.0%, a difference of 0.24%), and Osage (5.0%, a difference of 0.24%). Similarly, the demographic groups most similar to Immigrants from France are Immigrants from Germany (5.1%, a difference of 0.20%), Immigrants from Malaysia (5.1%, a difference of 0.24%), Immigrants from Sri Lanka (5.1%, a difference of 0.26%), Immigrants from Western Europe (5.1%, a difference of 0.27%), and Immigrants from Ireland (5.1%, a difference of 0.48%).
| Demographics | Rating | Rank | Unemployment |
| Mongolians | 94.8 /100 | #99 | Exceptional 5.0% |
| Estonians | 94.6 /100 | #100 | Exceptional 5.0% |
| Americans | 94.3 /100 | #101 | Exceptional 5.0% |
| Immigrants | Argentina | 94.1 /100 | #102 | Exceptional 5.0% |
| Chickasaw | 94.0 /100 | #103 | Exceptional 5.0% |
| Osage | 94.0 /100 | #104 | Exceptional 5.0% |
| Maltese | 94.0 /100 | #105 | Exceptional 5.0% |
| Immigrants | Romania | 93.7 /100 | #106 | Exceptional 5.0% |
| Immigrants | Turkey | 93.7 /100 | #107 | Exceptional 5.0% |
| Immigrants | Kuwait | 93.7 /100 | #108 | Exceptional 5.0% |
| Immigrants | Eritrea | 93.3 /100 | #109 | Exceptional 5.0% |
| Immigrants | Lithuania | 93.2 /100 | #110 | Exceptional 5.0% |
| Chileans | 93.2 /100 | #111 | Exceptional 5.0% |
| South Africans | 92.6 /100 | #112 | Exceptional 5.1% |
| Argentineans | 92.4 /100 | #113 | Exceptional 5.1% |
| Immigrants | Ireland | 92.1 /100 | #114 | Exceptional 5.1% |
| Immigrants | Western Europe | 91.1 /100 | #115 | Exceptional 5.1% |
| Immigrants | Sri Lanka | 91.1 /100 | #116 | Exceptional 5.1% |
| Immigrants | Malaysia | 91.0 /100 | #117 | Exceptional 5.1% |
| Immigrants | Germany | 90.8 /100 | #118 | Exceptional 5.1% |
| Immigrants | France | 89.7 /100 | #119 | Excellent 5.1% |