Nonimmigrants vs Liberian Male Unemployment
COMPARE
Nonimmigrants
Liberian
Male Unemployment
Male Unemployment Comparison
Nonimmigrants
Liberians
5.4%
MALE UNEMPLOYMENT
13.1/ 100
METRIC RATING
202nd/ 347
METRIC RANK
5.8%
MALE UNEMPLOYMENT
0.1/ 100
METRIC RATING
261st/ 347
METRIC RANK
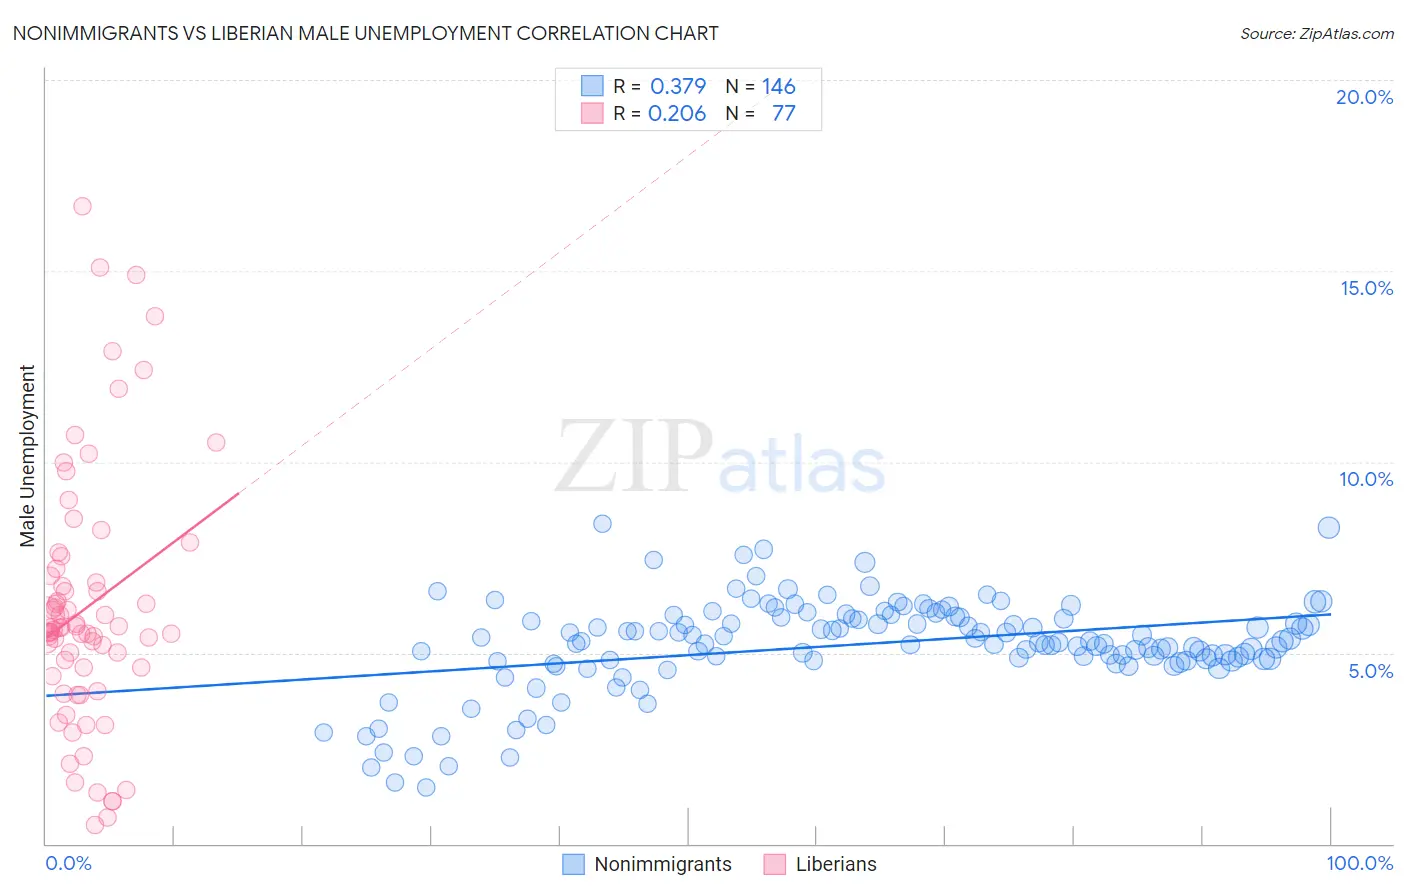
Nonimmigrants vs Liberian Male Unemployment Correlation Chart
The statistical analysis conducted on geographies consisting of 570,841,743 people shows a mild positive correlation between the proportion of Nonimmigrants and unemployment rate among males in the United States with a correlation coefficient (R) of 0.379 and weighted average of 5.4%. Similarly, the statistical analysis conducted on geographies consisting of 117,984,986 people shows a weak positive correlation between the proportion of Liberians and unemployment rate among males in the United States with a correlation coefficient (R) of 0.206 and weighted average of 5.8%, a difference of 7.2%.
Male Unemployment Correlation Summary
| Measurement | Nonimmigrants | Liberian |
| Minimum | 1.5% | 0.50% |
| Maximum | 8.4% | 16.7% |
| Range | 6.9% | 16.2% |
| Mean | 5.2% | 6.2% |
| Median | 5.3% | 5.7% |
| Interquartile 25% (IQ1) | 4.8% | 4.5% |
| Interquartile 75% (IQ3) | 5.9% | 7.1% |
| Interquartile Range (IQR) | 1.1% | 2.6% |
| Standard Deviation (Sample) | 1.2% | 3.3% |
| Standard Deviation (Population) | 1.2% | 3.3% |
Similar Demographics by Male Unemployment
Demographics Similar to Nonimmigrants by Male Unemployment
In terms of male unemployment, the demographic groups most similar to Nonimmigrants are Immigrants from Laos (5.4%, a difference of 0.010%), Immigrants from Philippines (5.4%, a difference of 0.040%), Immigrants from Zaire (5.4%, a difference of 0.070%), Guamanian/Chamorro (5.4%, a difference of 0.10%), and Immigrants from Greece (5.4%, a difference of 0.16%).
| Demographics | Rating | Rank | Male Unemployment |
| Immigrants | Southern Europe | 17.7 /100 | #195 | Poor 5.4% |
| Albanians | 17.3 /100 | #196 | Poor 5.4% |
| Alsatians | 16.7 /100 | #197 | Poor 5.4% |
| Immigrants | Thailand | 14.7 /100 | #198 | Poor 5.4% |
| Immigrants | Greece | 14.5 /100 | #199 | Poor 5.4% |
| Immigrants | Zaire | 13.7 /100 | #200 | Poor 5.4% |
| Immigrants | Philippines | 13.5 /100 | #201 | Poor 5.4% |
| Immigrants | Nonimmigrants | 13.1 /100 | #202 | Poor 5.4% |
| Immigrants | Laos | 13.0 /100 | #203 | Poor 5.4% |
| Guamanians/Chamorros | 12.3 /100 | #204 | Poor 5.4% |
| Immigrants | Costa Rica | 11.4 /100 | #205 | Poor 5.5% |
| Immigrants | Ukraine | 9.9 /100 | #206 | Tragic 5.5% |
| Immigrants | Syria | 9.3 /100 | #207 | Tragic 5.5% |
| Immigrants | Lebanon | 8.6 /100 | #208 | Tragic 5.5% |
| Immigrants | Middle Africa | 8.3 /100 | #209 | Tragic 5.5% |
Demographics Similar to Liberians by Male Unemployment
In terms of male unemployment, the demographic groups most similar to Liberians are Immigrants from Central America (5.8%, a difference of 0.18%), Cajun (5.8%, a difference of 0.24%), Dutch West Indian (5.8%, a difference of 0.39%), Immigrants from Portugal (5.9%, a difference of 0.45%), and Hispanic or Latino (5.8%, a difference of 0.53%).
| Demographics | Rating | Rank | Male Unemployment |
| Japanese | 0.2 /100 | #254 | Tragic 5.8% |
| Kiowa | 0.2 /100 | #255 | Tragic 5.8% |
| Comanche | 0.2 /100 | #256 | Tragic 5.8% |
| Hispanics or Latinos | 0.1 /100 | #257 | Tragic 5.8% |
| Dutch West Indians | 0.1 /100 | #258 | Tragic 5.8% |
| Cajuns | 0.1 /100 | #259 | Tragic 5.8% |
| Immigrants | Central America | 0.1 /100 | #260 | Tragic 5.8% |
| Liberians | 0.1 /100 | #261 | Tragic 5.8% |
| Immigrants | Portugal | 0.1 /100 | #262 | Tragic 5.9% |
| Immigrants | Latin America | 0.1 /100 | #263 | Tragic 5.9% |
| Immigrants | Mexico | 0.0 /100 | #264 | Tragic 5.9% |
| French American Indians | 0.0 /100 | #265 | Tragic 5.9% |
| Bahamians | 0.0 /100 | #266 | Tragic 5.9% |
| Nigerians | 0.0 /100 | #267 | Tragic 5.9% |
| Bermudans | 0.0 /100 | #268 | Tragic 5.9% |