Paiute vs Native/Alaskan Unemployment Among Ages 35 to 44 years
COMPARE
Paiute
Native/Alaskan
Unemployment Among Ages 35 to 44 years
Unemployment Among Ages 35 to 44 years Comparison
Paiute
Natives/Alaskans
6.9%
UNEMPLOYMENT AMONG AGES 35 TO 44 YEARS
0.0/ 100
METRIC RATING
329th/ 347
METRIC RANK
7.3%
UNEMPLOYMENT AMONG AGES 35 TO 44 YEARS
0.0/ 100
METRIC RATING
332nd/ 347
METRIC RANK
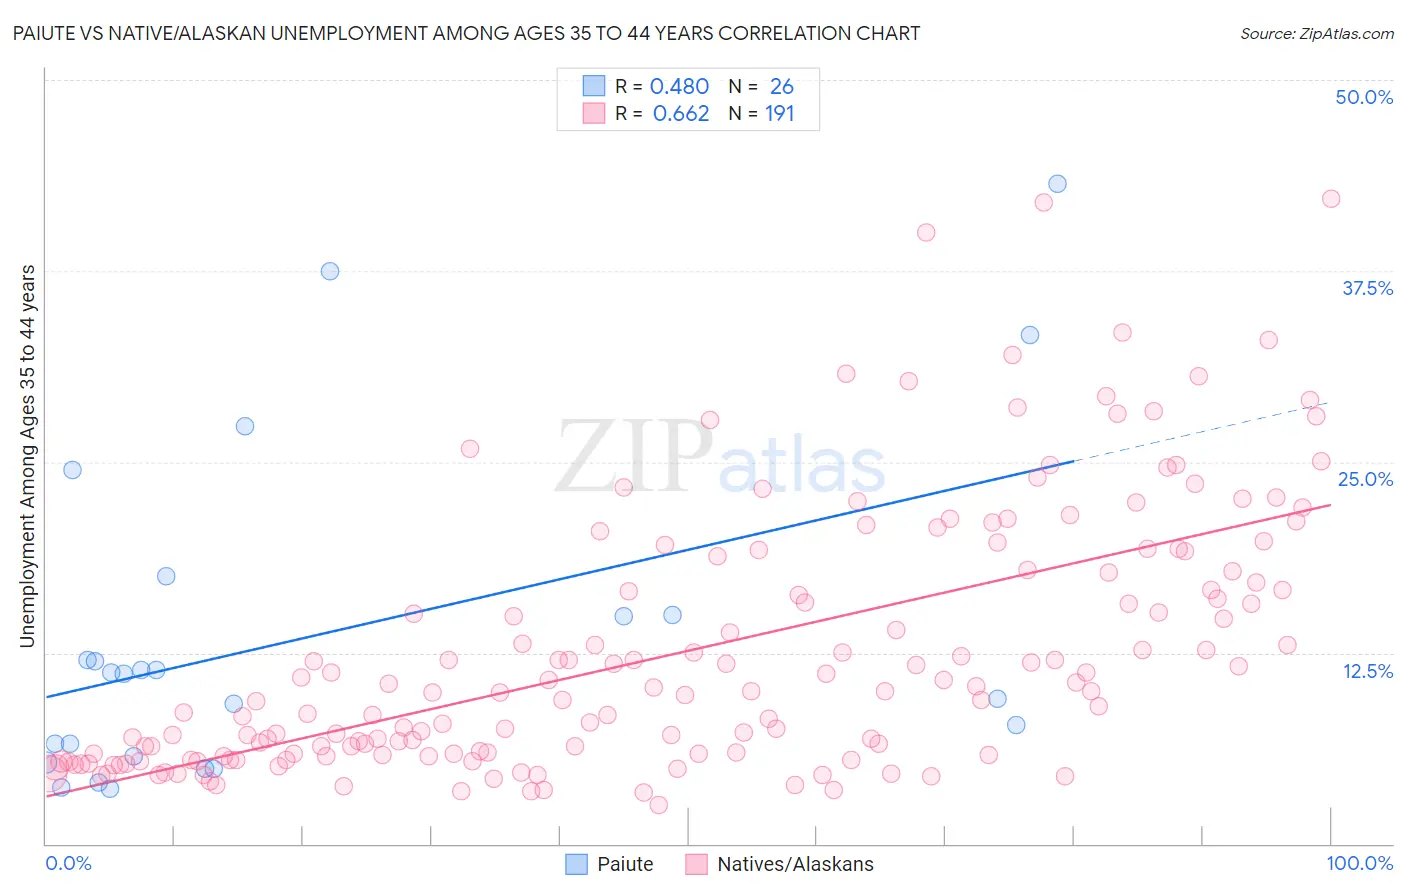
Paiute vs Native/Alaskan Unemployment Among Ages 35 to 44 years Correlation Chart
The statistical analysis conducted on geographies consisting of 58,087,463 people shows a moderate positive correlation between the proportion of Paiute and unemployment rate among population between the ages 35 and 44 in the United States with a correlation coefficient (R) of 0.480 and weighted average of 6.9%. Similarly, the statistical analysis conducted on geographies consisting of 490,779,782 people shows a significant positive correlation between the proportion of Natives/Alaskans and unemployment rate among population between the ages 35 and 44 in the United States with a correlation coefficient (R) of 0.662 and weighted average of 7.3%, a difference of 5.5%.
Unemployment Among Ages 35 to 44 years Correlation Summary
| Measurement | Paiute | Native/Alaskan |
| Minimum | 3.6% | 2.5% |
| Maximum | 43.2% | 42.2% |
| Range | 39.6% | 39.7% |
| Mean | 13.6% | 12.6% |
| Median | 11.2% | 10.0% |
| Interquartile 25% (IQ1) | 5.7% | 5.8% |
| Interquartile 75% (IQ3) | 15.0% | 17.9% |
| Interquartile Range (IQR) | 9.3% | 12.0% |
| Standard Deviation (Sample) | 10.8% | 8.5% |
| Standard Deviation (Population) | 10.6% | 8.5% |
Demographics Similar to Paiute and Natives/Alaskans by Unemployment Among Ages 35 to 44 years
In terms of unemployment among ages 35 to 44 years, the demographic groups most similar to Paiute are Immigrants from Cabo Verde (6.9%, a difference of 0.020%), Pueblo (7.1%, a difference of 2.5%), Shoshone (6.6%, a difference of 4.1%), Cape Verdean (6.6%, a difference of 4.8%), and Alaska Native (6.6%, a difference of 4.9%). Similarly, the demographic groups most similar to Natives/Alaskans are Pueblo (7.1%, a difference of 2.9%), Puerto Rican (7.6%, a difference of 5.2%), Immigrants from Cabo Verde (6.9%, a difference of 5.5%), Houma (7.8%, a difference of 8.0%), and Shoshone (6.6%, a difference of 9.8%).
| Demographics | Rating | Rank | Unemployment Among Ages 35 to 44 years |
| Immigrants | Armenia | 0.0 /100 | #320 | Tragic 6.2% |
| Chippewa | 0.0 /100 | #321 | Tragic 6.2% |
| Immigrants | Dominican Republic | 0.0 /100 | #322 | Tragic 6.4% |
| Dominicans | 0.0 /100 | #323 | Tragic 6.4% |
| Menominee | 0.0 /100 | #324 | Tragic 6.5% |
| Immigrants | Yemen | 0.0 /100 | #325 | Tragic 6.6% |
| Alaska Natives | 0.0 /100 | #326 | Tragic 6.6% |
| Cape Verdeans | 0.0 /100 | #327 | Tragic 6.6% |
| Shoshone | 0.0 /100 | #328 | Tragic 6.6% |
| Paiute | 0.0 /100 | #329 | Tragic 6.9% |
| Immigrants | Cabo Verde | 0.0 /100 | #330 | Tragic 6.9% |
| Pueblo | 0.0 /100 | #331 | Tragic 7.1% |
| Natives/Alaskans | 0.0 /100 | #332 | Tragic 7.3% |
| Puerto Ricans | 0.0 /100 | #333 | Tragic 7.6% |
| Houma | 0.0 /100 | #334 | Tragic 7.8% |
| Sioux | 0.0 /100 | #335 | Tragic 8.4% |
| Apache | 0.0 /100 | #336 | Tragic 8.4% |
| Tohono O'odham | 0.0 /100 | #337 | Tragic 8.4% |
| Cheyenne | 0.0 /100 | #338 | Tragic 8.5% |
| Inupiat | 0.0 /100 | #339 | Tragic 8.6% |
| Alaskan Athabascans | 0.0 /100 | #340 | Tragic 8.6% |