Pakistani vs Immigrants from Canada Unemployment Among Ages 45 to 54 years
COMPARE
Pakistani
Immigrants from Canada
Unemployment Among Ages 45 to 54 years
Unemployment Among Ages 45 to 54 years Comparison
Pakistanis
Immigrants from Canada
4.4%
UNEMPLOYMENT AMONG AGES 45 TO 54 YEARS
90.7/ 100
METRIC RATING
115th/ 347
METRIC RANK
4.4%
UNEMPLOYMENT AMONG AGES 45 TO 54 YEARS
95.0/ 100
METRIC RATING
97th/ 347
METRIC RANK
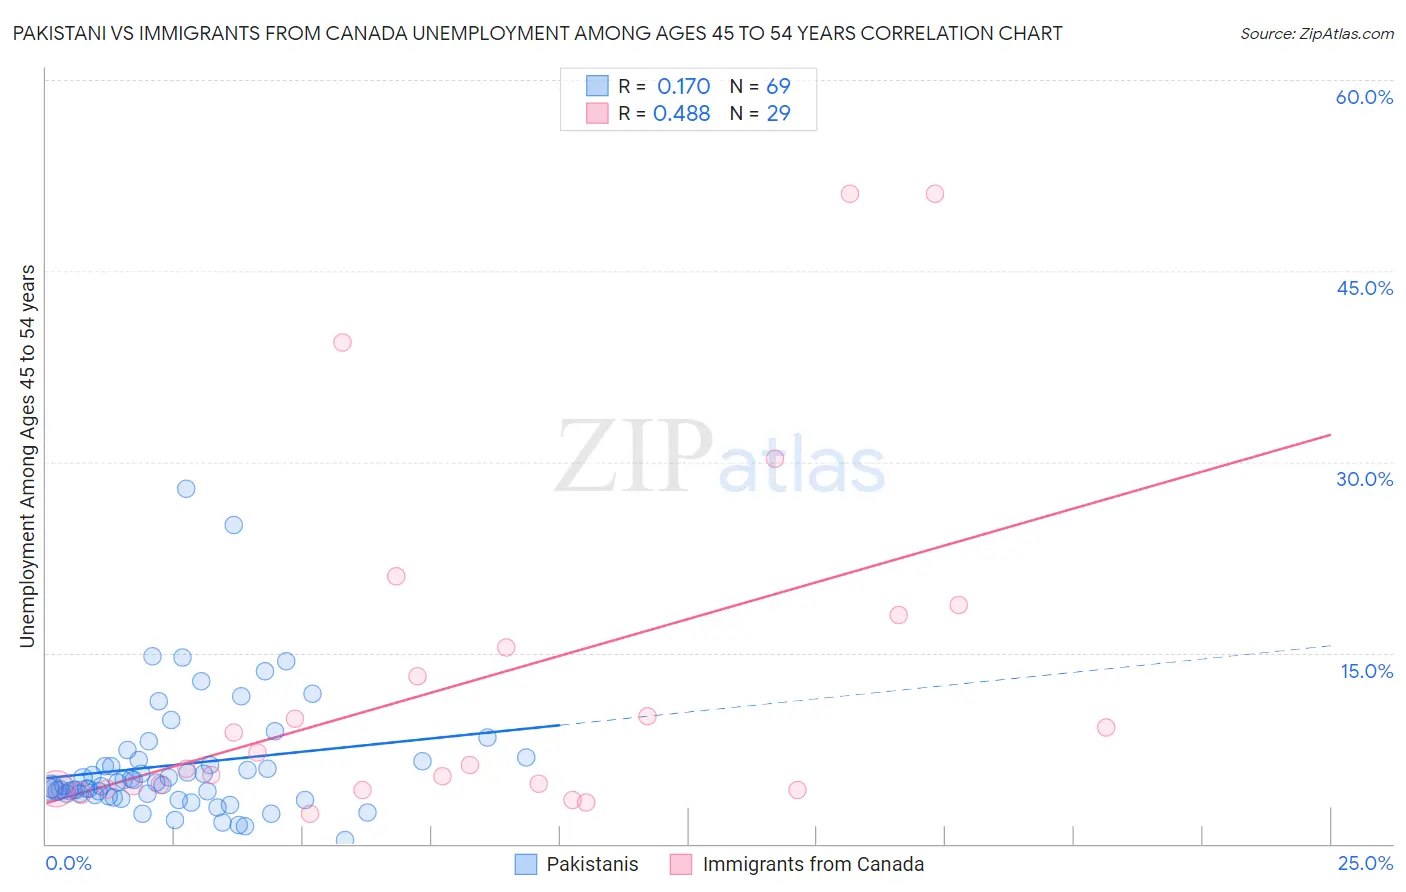
Pakistani vs Immigrants from Canada Unemployment Among Ages 45 to 54 years Correlation Chart
The statistical analysis conducted on geographies consisting of 329,355,930 people shows a poor positive correlation between the proportion of Pakistanis and unemployment rate among population between the ages 45 and 54 in the United States with a correlation coefficient (R) of 0.170 and weighted average of 4.4%. Similarly, the statistical analysis conducted on geographies consisting of 441,879,123 people shows a moderate positive correlation between the proportion of Immigrants from Canada and unemployment rate among population between the ages 45 and 54 in the United States with a correlation coefficient (R) of 0.488 and weighted average of 4.4%, a difference of 0.79%.
Unemployment Among Ages 45 to 54 years Correlation Summary
| Measurement | Pakistani | Immigrants from Canada |
| Minimum | 0.30% | 2.4% |
| Maximum | 27.9% | 51.1% |
| Range | 27.6% | 48.7% |
| Mean | 6.2% | 12.7% |
| Median | 4.6% | 6.2% |
| Interquartile 25% (IQ1) | 3.9% | 4.3% |
| Interquartile 75% (IQ3) | 6.5% | 16.7% |
| Interquartile Range (IQR) | 2.7% | 12.4% |
| Standard Deviation (Sample) | 4.8% | 13.7% |
| Standard Deviation (Population) | 4.8% | 13.4% |
Demographics Similar to Pakistanis and Immigrants from Canada by Unemployment Among Ages 45 to 54 years
In terms of unemployment among ages 45 to 54 years, the demographic groups most similar to Pakistanis are Immigrants from Chile (4.4%, a difference of 0.020%), Immigrants from North Macedonia (4.4%, a difference of 0.020%), French Canadian (4.4%, a difference of 0.040%), Immigrants from Saudi Arabia (4.4%, a difference of 0.050%), and Immigrants from Nicaragua (4.4%, a difference of 0.080%). Similarly, the demographic groups most similar to Immigrants from Canada are Romanian (4.4%, a difference of 0.010%), Immigrants from Burma/Myanmar (4.4%, a difference of 0.020%), Immigrants from Eritrea (4.4%, a difference of 0.060%), Indonesian (4.4%, a difference of 0.13%), and Immigrants from North America (4.4%, a difference of 0.24%).
| Demographics | Rating | Rank | Unemployment Among Ages 45 to 54 years |
| Indonesians | 95.4 /100 | #96 | Exceptional 4.4% |
| Immigrants | Canada | 95.0 /100 | #97 | Exceptional 4.4% |
| Romanians | 94.9 /100 | #98 | Exceptional 4.4% |
| Immigrants | Burma/Myanmar | 94.9 /100 | #99 | Exceptional 4.4% |
| Immigrants | Eritrea | 94.7 /100 | #100 | Exceptional 4.4% |
| Immigrants | North America | 93.9 /100 | #101 | Exceptional 4.4% |
| Sri Lankans | 93.7 /100 | #102 | Exceptional 4.4% |
| Icelanders | 93.5 /100 | #103 | Exceptional 4.4% |
| Immigrants | Sweden | 93.0 /100 | #104 | Exceptional 4.4% |
| Immigrants | Kenya | 92.8 /100 | #105 | Exceptional 4.4% |
| Iranians | 92.5 /100 | #106 | Exceptional 4.4% |
| Immigrants | South Africa | 92.5 /100 | #107 | Exceptional 4.4% |
| Russians | 92.1 /100 | #108 | Exceptional 4.4% |
| New Zealanders | 91.9 /100 | #109 | Exceptional 4.4% |
| Immigrants | England | 91.3 /100 | #110 | Exceptional 4.4% |
| Immigrants | Nicaragua | 91.3 /100 | #111 | Exceptional 4.4% |
| Immigrants | Saudi Arabia | 91.1 /100 | #112 | Exceptional 4.4% |
| French Canadians | 91.0 /100 | #113 | Exceptional 4.4% |
| Immigrants | Chile | 90.9 /100 | #114 | Exceptional 4.4% |
| Pakistanis | 90.7 /100 | #115 | Exceptional 4.4% |
| Immigrants | North Macedonia | 90.6 /100 | #116 | Exceptional 4.4% |