Panamanian vs Immigrants from Kazakhstan Male Unemployment
COMPARE
Panamanian
Immigrants from Kazakhstan
Male Unemployment
Male Unemployment Comparison
Panamanians
Immigrants from Kazakhstan
5.6%
MALE UNEMPLOYMENT
1.9/ 100
METRIC RATING
225th/ 347
METRIC RANK
5.3%
MALE UNEMPLOYMENT
50.8/ 100
METRIC RATING
172nd/ 347
METRIC RANK
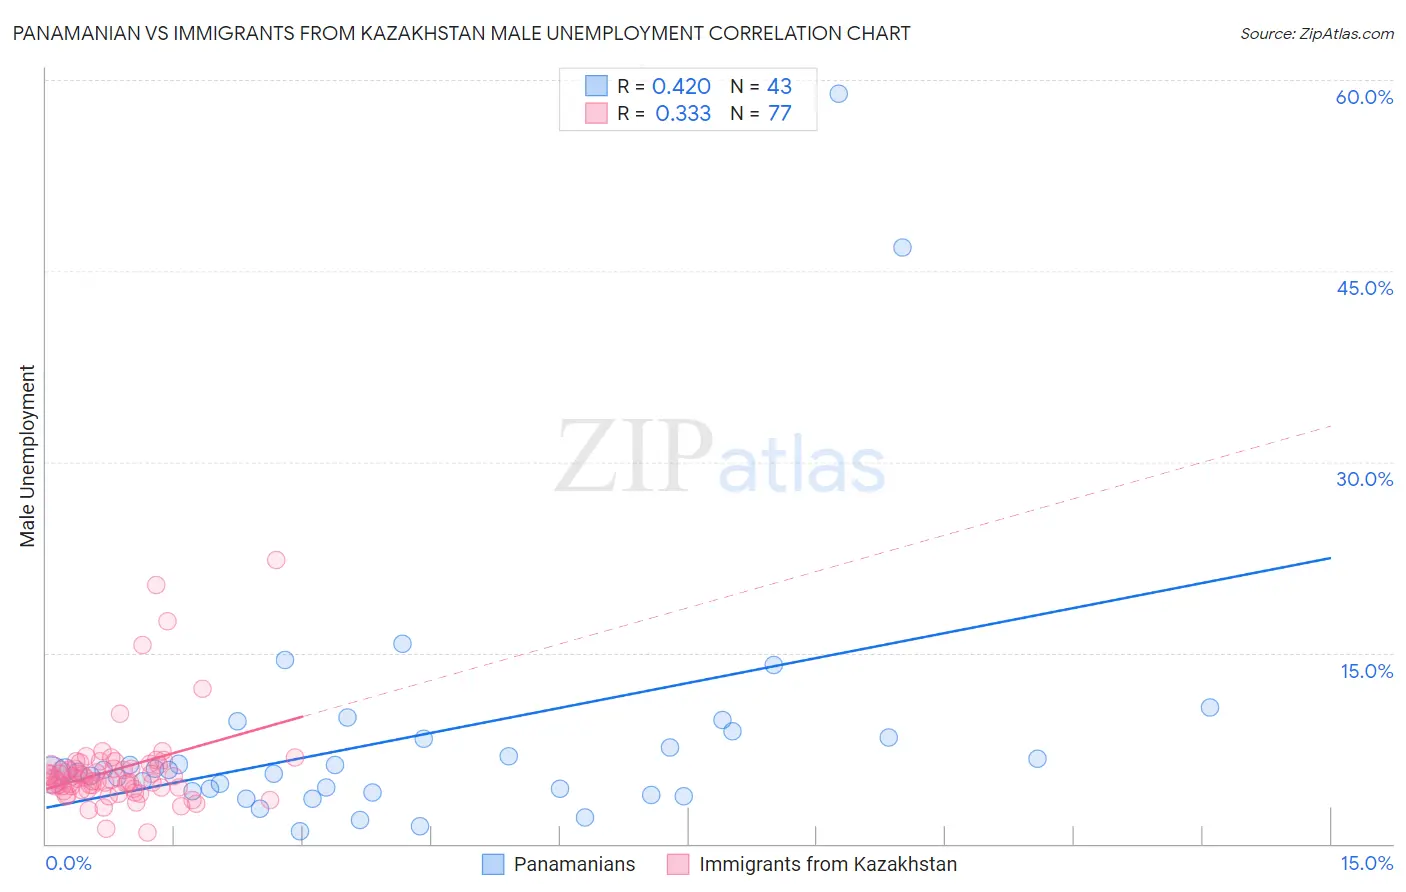
Panamanian vs Immigrants from Kazakhstan Male Unemployment Correlation Chart
The statistical analysis conducted on geographies consisting of 280,561,708 people shows a moderate positive correlation between the proportion of Panamanians and unemployment rate among males in the United States with a correlation coefficient (R) of 0.420 and weighted average of 5.6%. Similarly, the statistical analysis conducted on geographies consisting of 124,296,316 people shows a mild positive correlation between the proportion of Immigrants from Kazakhstan and unemployment rate among males in the United States with a correlation coefficient (R) of 0.333 and weighted average of 5.3%, a difference of 5.8%.
Male Unemployment Correlation Summary
| Measurement | Panamanian | Immigrants from Kazakhstan |
| Minimum | 1.0% | 0.90% |
| Maximum | 58.9% | 22.3% |
| Range | 57.9% | 21.4% |
| Mean | 8.4% | 5.8% |
| Median | 5.8% | 5.1% |
| Interquartile 25% (IQ1) | 4.2% | 4.4% |
| Interquartile 75% (IQ3) | 8.3% | 6.2% |
| Interquartile Range (IQR) | 4.1% | 1.8% |
| Standard Deviation (Sample) | 10.5% | 3.5% |
| Standard Deviation (Population) | 10.4% | 3.5% |
Similar Demographics by Male Unemployment
Demographics Similar to Panamanians by Male Unemployment
In terms of male unemployment, the demographic groups most similar to Panamanians are Immigrants from Cambodia (5.6%, a difference of 0.090%), Immigrants from Panama (5.6%, a difference of 0.090%), Seminole (5.6%, a difference of 0.11%), Central American (5.6%, a difference of 0.11%), and Immigrants from Africa (5.6%, a difference of 0.15%).
| Demographics | Rating | Rank | Male Unemployment |
| Immigrants | Albania | 3.6 /100 | #218 | Tragic 5.5% |
| Immigrants | Western Asia | 3.5 /100 | #219 | Tragic 5.6% |
| Portuguese | 3.5 /100 | #220 | Tragic 5.6% |
| Soviet Union | 3.2 /100 | #221 | Tragic 5.6% |
| Immigrants | Micronesia | 2.9 /100 | #222 | Tragic 5.6% |
| Creek | 2.6 /100 | #223 | Tragic 5.6% |
| Cherokee | 2.4 /100 | #224 | Tragic 5.6% |
| Panamanians | 1.9 /100 | #225 | Tragic 5.6% |
| Immigrants | Cambodia | 1.8 /100 | #226 | Tragic 5.6% |
| Immigrants | Panama | 1.8 /100 | #227 | Tragic 5.6% |
| Seminole | 1.8 /100 | #228 | Tragic 5.6% |
| Central Americans | 1.8 /100 | #229 | Tragic 5.6% |
| Immigrants | Africa | 1.7 /100 | #230 | Tragic 5.6% |
| Choctaw | 1.6 /100 | #231 | Tragic 5.6% |
| Moroccans | 1.6 /100 | #232 | Tragic 5.6% |
Demographics Similar to Immigrants from Kazakhstan by Male Unemployment
In terms of male unemployment, the demographic groups most similar to Immigrants from Kazakhstan are Immigrants from Russia (5.3%, a difference of 0.010%), Immigrants from Iran (5.3%, a difference of 0.050%), Peruvian (5.3%, a difference of 0.060%), Immigrants from Iraq (5.3%, a difference of 0.16%), and Immigrants from Eastern Europe (5.3%, a difference of 0.19%).
| Demographics | Rating | Rank | Male Unemployment |
| South Americans | 60.6 /100 | #165 | Good 5.3% |
| Immigrants | Morocco | 60.2 /100 | #166 | Good 5.3% |
| Immigrants | Vietnam | 58.1 /100 | #167 | Average 5.3% |
| Immigrants | Ireland | 57.7 /100 | #168 | Average 5.3% |
| Immigrants | Congo | 57.4 /100 | #169 | Average 5.3% |
| Immigrants | Eastern Europe | 54.1 /100 | #170 | Average 5.3% |
| Peruvians | 51.9 /100 | #171 | Average 5.3% |
| Immigrants | Kazakhstan | 50.8 /100 | #172 | Average 5.3% |
| Immigrants | Russia | 50.7 /100 | #173 | Average 5.3% |
| Immigrants | Iran | 50.0 /100 | #174 | Average 5.3% |
| Immigrants | Iraq | 48.1 /100 | #175 | Average 5.3% |
| Immigrants | Poland | 46.0 /100 | #176 | Average 5.3% |
| Immigrants | Peru | 44.6 /100 | #177 | Average 5.3% |
| Osage | 42.5 /100 | #178 | Average 5.3% |
| Immigrants | Oceania | 40.8 /100 | #179 | Average 5.3% |