Senegalese vs Immigrants from Scotland Unemployment Among Ages 65 to 74 years
COMPARE
Senegalese
Immigrants from Scotland
Unemployment Among Ages 65 to 74 years
Unemployment Among Ages 65 to 74 years Comparison
Senegalese
Immigrants from Scotland
5.2%
UNEMPLOYMENT AMONG AGES 65 TO 74 YEARS
96.5/ 100
METRIC RATING
97th/ 347
METRIC RANK
5.2%
UNEMPLOYMENT AMONG AGES 65 TO 74 YEARS
98.6/ 100
METRIC RATING
81st/ 347
METRIC RANK
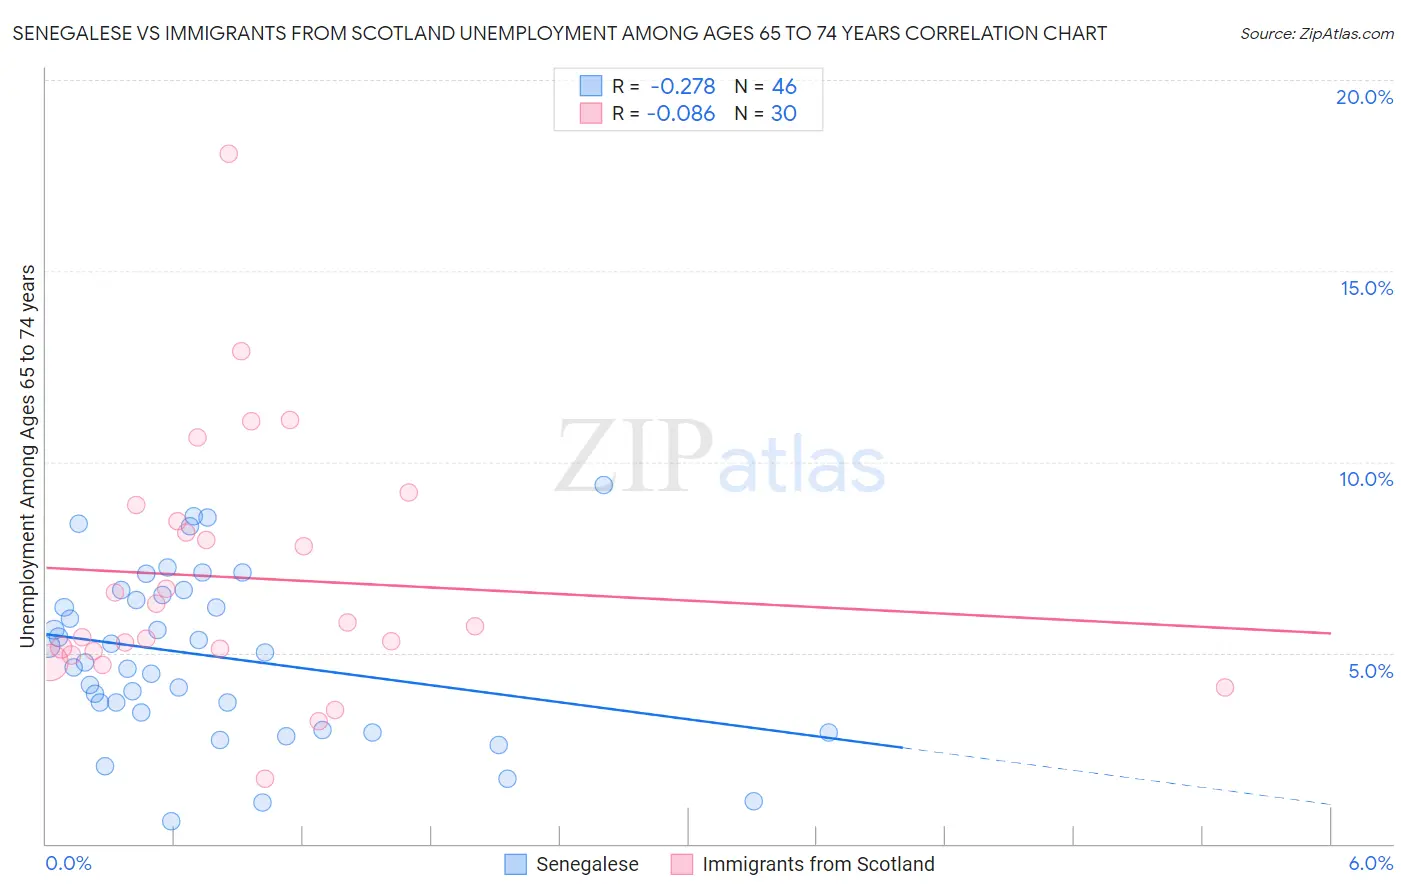
Senegalese vs Immigrants from Scotland Unemployment Among Ages 65 to 74 years Correlation Chart
The statistical analysis conducted on geographies consisting of 75,763,362 people shows a weak negative correlation between the proportion of Senegalese and unemployment rate among population between the ages 65 and 74 in the United States with a correlation coefficient (R) of -0.278 and weighted average of 5.2%. Similarly, the statistical analysis conducted on geographies consisting of 183,030,600 people shows a slight negative correlation between the proportion of Immigrants from Scotland and unemployment rate among population between the ages 65 and 74 in the United States with a correlation coefficient (R) of -0.086 and weighted average of 5.2%, a difference of 0.81%.
Unemployment Among Ages 65 to 74 years Correlation Summary
| Measurement | Senegalese | Immigrants from Scotland |
| Minimum | 0.60% | 1.7% |
| Maximum | 9.4% | 18.1% |
| Range | 8.8% | 16.4% |
| Mean | 4.9% | 7.0% |
| Median | 4.9% | 5.8% |
| Interquartile 25% (IQ1) | 3.4% | 5.0% |
| Interquartile 75% (IQ3) | 6.5% | 8.5% |
| Interquartile Range (IQR) | 3.1% | 3.4% |
| Standard Deviation (Sample) | 2.2% | 3.3% |
| Standard Deviation (Population) | 2.1% | 3.3% |
Demographics Similar to Senegalese and Immigrants from Scotland by Unemployment Among Ages 65 to 74 years
In terms of unemployment among ages 65 to 74 years, the demographic groups most similar to Senegalese are Welsh (5.2%, a difference of 0.010%), Burmese (5.2%, a difference of 0.030%), Immigrants from Thailand (5.2%, a difference of 0.12%), Serbian (5.2%, a difference of 0.14%), and South African (5.2%, a difference of 0.15%). Similarly, the demographic groups most similar to Immigrants from Scotland are Thai (5.2%, a difference of 0.0%), Immigrants from South Africa (5.2%, a difference of 0.010%), Slavic (5.2%, a difference of 0.030%), Immigrants from Middle Africa (5.2%, a difference of 0.15%), and Immigrants from Hungary (5.2%, a difference of 0.33%).
| Demographics | Rating | Rank | Unemployment Among Ages 65 to 74 years |
| Slavs | 98.7 /100 | #79 | Exceptional 5.2% |
| Immigrants | South Africa | 98.6 /100 | #80 | Exceptional 5.2% |
| Immigrants | Scotland | 98.6 /100 | #81 | Exceptional 5.2% |
| Thais | 98.6 /100 | #82 | Exceptional 5.2% |
| Immigrants | Middle Africa | 98.4 /100 | #83 | Exceptional 5.2% |
| Immigrants | Hungary | 98.0 /100 | #84 | Exceptional 5.2% |
| British | 97.9 /100 | #85 | Exceptional 5.2% |
| Danes | 97.9 /100 | #86 | Exceptional 5.2% |
| Scottish | 97.9 /100 | #87 | Exceptional 5.2% |
| Immigrants | Saudi Arabia | 97.9 /100 | #88 | Exceptional 5.2% |
| English | 97.8 /100 | #89 | Exceptional 5.2% |
| Luxembourgers | 97.6 /100 | #90 | Exceptional 5.2% |
| Romanians | 97.4 /100 | #91 | Exceptional 5.2% |
| Puget Sound Salish | 97.3 /100 | #92 | Exceptional 5.2% |
| Immigrants | Netherlands | 97.1 /100 | #93 | Exceptional 5.2% |
| South Africans | 97.1 /100 | #94 | Exceptional 5.2% |
| Serbians | 97.0 /100 | #95 | Exceptional 5.2% |
| Immigrants | Thailand | 97.0 /100 | #96 | Exceptional 5.2% |
| Senegalese | 96.5 /100 | #97 | Exceptional 5.2% |
| Welsh | 96.5 /100 | #98 | Exceptional 5.2% |
| Burmese | 96.4 /100 | #99 | Exceptional 5.2% |