Shoshone vs Kenyan Unemployment Among Ages 55 to 59 years
COMPARE
Shoshone
Kenyan
Unemployment Among Ages 55 to 59 years
Unemployment Among Ages 55 to 59 years Comparison
Shoshone
Kenyans
7.4%
UNEMPLOYMENT AMONG AGES 55 TO 59 YEARS
0.0/ 100
METRIC RATING
341st/ 347
METRIC RANK
4.4%
UNEMPLOYMENT AMONG AGES 55 TO 59 YEARS
100.0/ 100
METRIC RATING
23rd/ 347
METRIC RANK
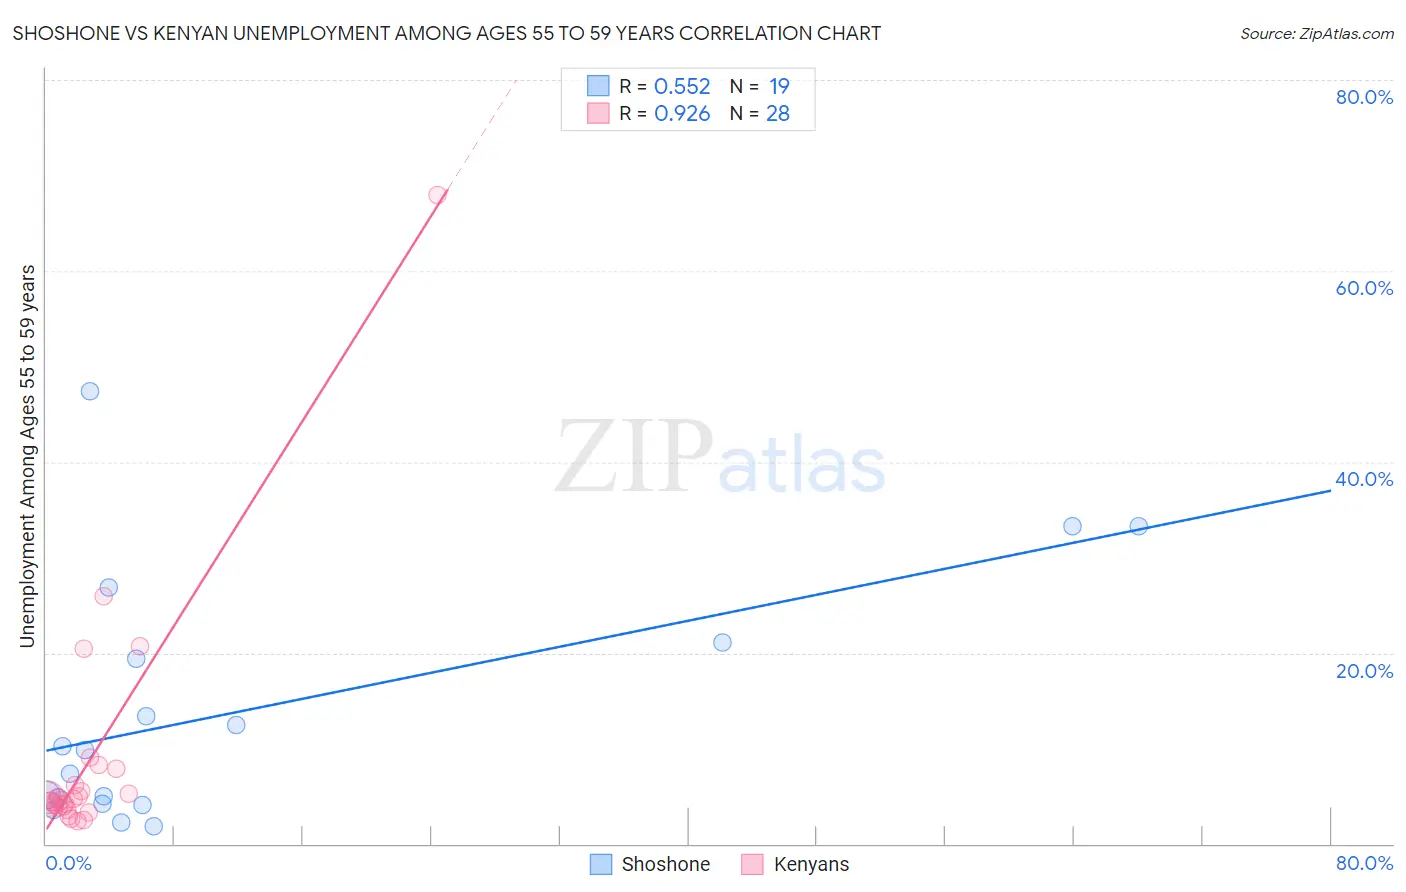
Shoshone vs Kenyan Unemployment Among Ages 55 to 59 years Correlation Chart
The statistical analysis conducted on geographies consisting of 64,919,646 people shows a substantial positive correlation between the proportion of Shoshone and unemployment rate among population between the ages 55 and 59 in the United States with a correlation coefficient (R) of 0.552 and weighted average of 7.4%. Similarly, the statistical analysis conducted on geographies consisting of 163,555,444 people shows a near-perfect positive correlation between the proportion of Kenyans and unemployment rate among population between the ages 55 and 59 in the United States with a correlation coefficient (R) of 0.926 and weighted average of 4.4%, a difference of 66.4%.
Unemployment Among Ages 55 to 59 years Correlation Summary
| Measurement | Shoshone | Kenyan |
| Minimum | 1.8% | 2.4% |
| Maximum | 47.4% | 68.0% |
| Range | 45.6% | 65.6% |
| Mean | 14.0% | 8.8% |
| Median | 9.9% | 4.7% |
| Interquartile 25% (IQ1) | 4.2% | 3.9% |
| Interquartile 75% (IQ3) | 21.1% | 7.0% |
| Interquartile Range (IQR) | 16.9% | 3.1% |
| Standard Deviation (Sample) | 13.0% | 13.0% |
| Standard Deviation (Population) | 12.6% | 12.7% |
Similar Demographics by Unemployment Among Ages 55 to 59 years
Demographics Similar to Shoshone by Unemployment Among Ages 55 to 59 years
In terms of unemployment among ages 55 to 59 years, the demographic groups most similar to Shoshone are Alaskan Athabascan (7.1%, a difference of 3.3%), Puerto Rican (7.0%, a difference of 5.9%), Immigrants from Yemen (6.9%, a difference of 7.0%), Paiute (6.8%, a difference of 9.1%), and Navajo (6.7%, a difference of 9.7%).
| Demographics | Rating | Rank | Unemployment Among Ages 55 to 59 years |
| Pima | 0.0 /100 | #333 | Tragic 6.6% |
| Pueblo | 0.0 /100 | #334 | Tragic 6.7% |
| Colville | 0.0 /100 | #335 | Tragic 6.7% |
| Navajo | 0.0 /100 | #336 | Tragic 6.7% |
| Paiute | 0.0 /100 | #337 | Tragic 6.8% |
| Immigrants | Yemen | 0.0 /100 | #338 | Tragic 6.9% |
| Puerto Ricans | 0.0 /100 | #339 | Tragic 7.0% |
| Alaskan Athabascans | 0.0 /100 | #340 | Tragic 7.1% |
| Shoshone | 0.0 /100 | #341 | Tragic 7.4% |
| Hopi | 0.0 /100 | #342 | Tragic 8.1% |
| Yakama | 0.0 /100 | #343 | Tragic 8.9% |
| Inupiat | 0.0 /100 | #344 | Tragic 9.0% |
| Tohono O'odham | 0.0 /100 | #345 | Tragic 9.3% |
| Menominee | 0.0 /100 | #346 | Tragic 10.5% |
| Yup'ik | 0.0 /100 | #347 | Tragic 13.9% |
Demographics Similar to Kenyans by Unemployment Among Ages 55 to 59 years
In terms of unemployment among ages 55 to 59 years, the demographic groups most similar to Kenyans are Immigrants from Burma/Myanmar (4.4%, a difference of 0.25%), Jordanian (4.4%, a difference of 0.29%), Immigrants from Eritrea (4.4%, a difference of 0.30%), Puget Sound Salish (4.4%, a difference of 0.35%), and Scandinavian (4.5%, a difference of 0.47%).
| Demographics | Rating | Rank | Unemployment Among Ages 55 to 59 years |
| Somalis | 100.0 /100 | #16 | Exceptional 4.4% |
| Czechs | 100.0 /100 | #17 | Exceptional 4.4% |
| Immigrants | Somalia | 100.0 /100 | #18 | Exceptional 4.4% |
| Chinese | 100.0 /100 | #19 | Exceptional 4.4% |
| Swedes | 100.0 /100 | #20 | Exceptional 4.4% |
| Puget Sound Salish | 100.0 /100 | #21 | Exceptional 4.4% |
| Immigrants | Burma/Myanmar | 100.0 /100 | #22 | Exceptional 4.4% |
| Kenyans | 100.0 /100 | #23 | Exceptional 4.4% |
| Jordanians | 100.0 /100 | #24 | Exceptional 4.4% |
| Immigrants | Eritrea | 100.0 /100 | #25 | Exceptional 4.4% |
| Scandinavians | 99.9 /100 | #26 | Exceptional 4.5% |
| Immigrants | Zimbabwe | 99.9 /100 | #27 | Exceptional 4.5% |
| Immigrants | Eastern Africa | 99.9 /100 | #28 | Exceptional 4.5% |
| Palestinians | 99.9 /100 | #29 | Exceptional 4.5% |
| Immigrants | Kenya | 99.9 /100 | #30 | Exceptional 4.5% |