Spanish American Indian vs Japanese Unemployment Among Women with Children Ages 6 to 17 years
COMPARE
Spanish American Indian
Japanese
Unemployment Among Women with Children Ages 6 to 17 years
Unemployment Among Women with Children Ages 6 to 17 years Comparison
Spanish American Indians
Japanese
8.2%
UNEMPLOYMENT AMONG WOMEN WITH CHILDREN AGES 6 TO 17 YEARS
100.0/ 100
METRIC RATING
62nd/ 347
METRIC RANK
8.4%
UNEMPLOYMENT AMONG WOMEN WITH CHILDREN AGES 6 TO 17 YEARS
99.5/ 100
METRIC RATING
84th/ 347
METRIC RANK
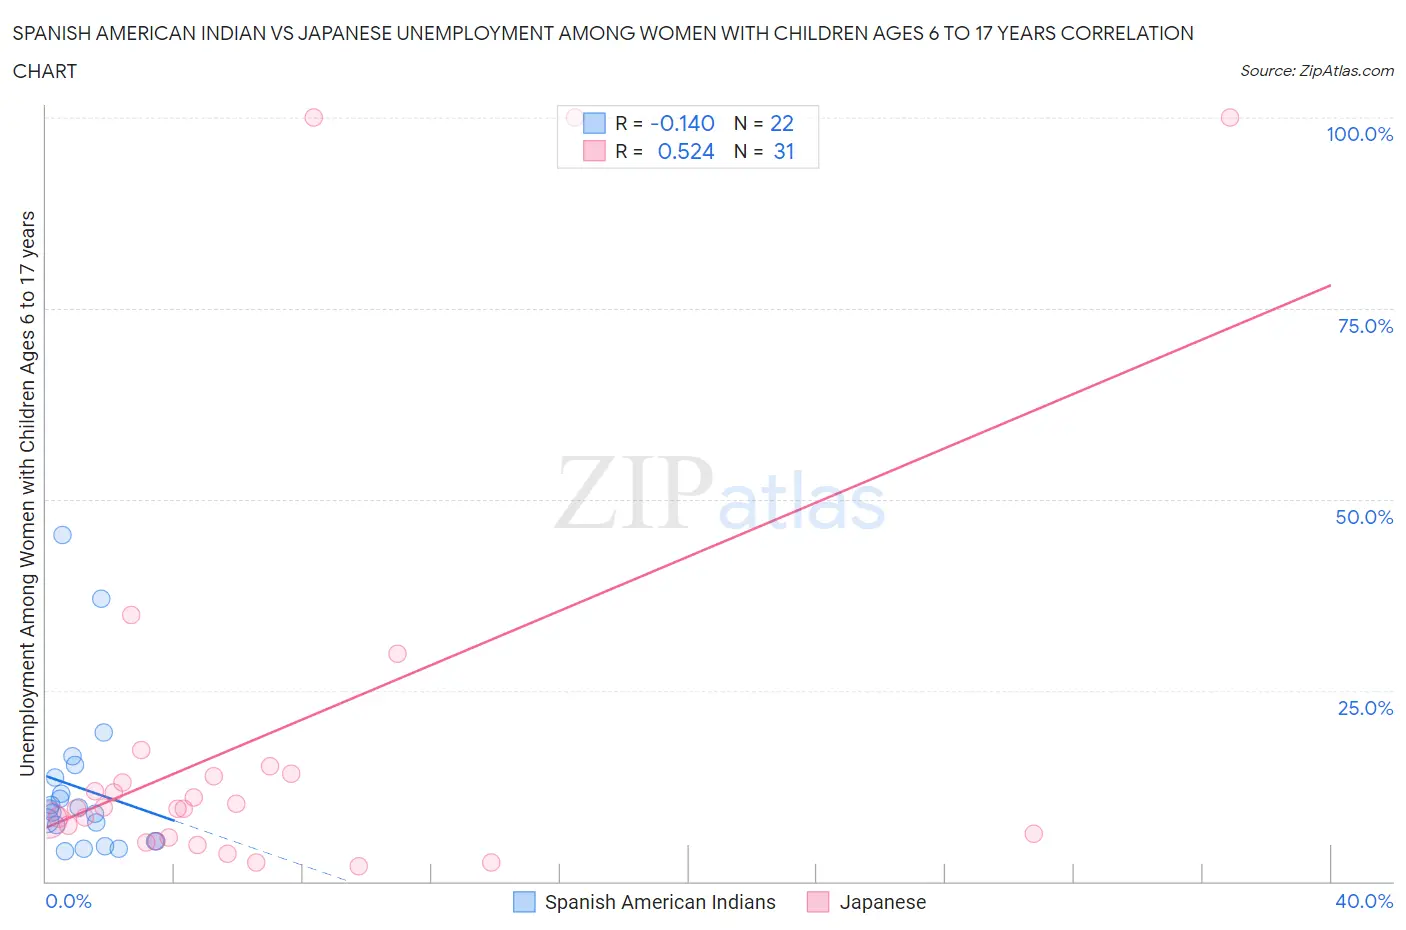
Spanish American Indian vs Japanese Unemployment Among Women with Children Ages 6 to 17 years Correlation Chart
The statistical analysis conducted on geographies consisting of 68,050,108 people shows a poor negative correlation between the proportion of Spanish American Indians and unemployment rate among women with children between the ages 6 and 17 in the United States with a correlation coefficient (R) of -0.140 and weighted average of 8.2%. Similarly, the statistical analysis conducted on geographies consisting of 199,688,096 people shows a substantial positive correlation between the proportion of Japanese and unemployment rate among women with children between the ages 6 and 17 in the United States with a correlation coefficient (R) of 0.524 and weighted average of 8.4%, a difference of 3.0%.
Unemployment Among Women with Children Ages 6 to 17 years Correlation Summary
| Measurement | Spanish American Indian | Japanese |
| Minimum | 4.0% | 2.0% |
| Maximum | 45.4% | 100.0% |
| Range | 41.4% | 98.0% |
| Mean | 12.1% | 19.0% |
| Median | 9.3% | 9.5% |
| Interquartile 25% (IQ1) | 5.3% | 5.7% |
| Interquartile 75% (IQ3) | 13.7% | 14.1% |
| Interquartile Range (IQR) | 8.4% | 8.4% |
| Standard Deviation (Sample) | 10.4% | 27.8% |
| Standard Deviation (Population) | 10.1% | 27.4% |
Similar Demographics by Unemployment Among Women with Children Ages 6 to 17 years
Demographics Similar to Spanish American Indians by Unemployment Among Women with Children Ages 6 to 17 years
In terms of unemployment among women with children ages 6 to 17 years, the demographic groups most similar to Spanish American Indians are Korean (8.2%, a difference of 0.030%), Immigrants from Philippines (8.2%, a difference of 0.22%), Basque (8.2%, a difference of 0.22%), Immigrants from Malaysia (8.2%, a difference of 0.28%), and Immigrants from South Eastern Asia (8.2%, a difference of 0.40%).
| Demographics | Rating | Rank | Unemployment Among Women with Children Ages 6 to 17 years |
| Immigrants | Japan | 100.0 /100 | #55 | Exceptional 8.2% |
| Immigrants | Bosnia and Herzegovina | 100.0 /100 | #56 | Exceptional 8.2% |
| Immigrants | Laos | 100.0 /100 | #57 | Exceptional 8.2% |
| Immigrants | Malaysia | 100.0 /100 | #58 | Exceptional 8.2% |
| Immigrants | Philippines | 100.0 /100 | #59 | Exceptional 8.2% |
| Basques | 100.0 /100 | #60 | Exceptional 8.2% |
| Koreans | 100.0 /100 | #61 | Exceptional 8.2% |
| Spanish American Indians | 100.0 /100 | #62 | Exceptional 8.2% |
| Immigrants | South Eastern Asia | 99.9 /100 | #63 | Exceptional 8.2% |
| Immigrants | Kuwait | 99.9 /100 | #64 | Exceptional 8.3% |
| Immigrants | Albania | 99.9 /100 | #65 | Exceptional 8.3% |
| Luxembourgers | 99.9 /100 | #66 | Exceptional 8.3% |
| Armenians | 99.9 /100 | #67 | Exceptional 8.3% |
| Marshallese | 99.9 /100 | #68 | Exceptional 8.3% |
| Immigrants | Thailand | 99.9 /100 | #69 | Exceptional 8.3% |
Demographics Similar to Japanese by Unemployment Among Women with Children Ages 6 to 17 years
In terms of unemployment among women with children ages 6 to 17 years, the demographic groups most similar to Japanese are Immigrants from North Macedonia (8.5%, a difference of 0.040%), Bulgarian (8.4%, a difference of 0.12%), Alaskan Athabascan (8.5%, a difference of 0.19%), Cypriot (8.4%, a difference of 0.28%), and Immigrants from Bolivia (8.4%, a difference of 0.30%).
| Demographics | Rating | Rank | Unemployment Among Women with Children Ages 6 to 17 years |
| Iraqis | 99.7 /100 | #77 | Exceptional 8.4% |
| Pakistanis | 99.6 /100 | #78 | Exceptional 8.4% |
| Mongolians | 99.6 /100 | #79 | Exceptional 8.4% |
| Immigrants | Belarus | 99.6 /100 | #80 | Exceptional 8.4% |
| Immigrants | Bolivia | 99.6 /100 | #81 | Exceptional 8.4% |
| Cypriots | 99.6 /100 | #82 | Exceptional 8.4% |
| Bulgarians | 99.5 /100 | #83 | Exceptional 8.4% |
| Japanese | 99.5 /100 | #84 | Exceptional 8.4% |
| Immigrants | North Macedonia | 99.4 /100 | #85 | Exceptional 8.5% |
| Alaskan Athabascans | 99.4 /100 | #86 | Exceptional 8.5% |
| Immigrants | Israel | 99.1 /100 | #87 | Exceptional 8.5% |
| Immigrants | Vietnam | 99.1 /100 | #88 | Exceptional 8.5% |
| Paiute | 99.1 /100 | #89 | Exceptional 8.5% |
| Yugoslavians | 99.0 /100 | #90 | Exceptional 8.5% |
| Immigrants | Eastern Europe | 99.0 /100 | #91 | Exceptional 8.5% |