Thai vs German Russian Unemployment Among Ages 30 to 34 years
COMPARE
Thai
German Russian
Unemployment Among Ages 30 to 34 years
Unemployment Among Ages 30 to 34 years Comparison
Thais
German Russians
4.7%
UNEMPLOYMENT AMONG AGES 30 TO 34 YEARS
100.0/ 100
METRIC RATING
7th/ 347
METRIC RANK
5.0%
UNEMPLOYMENT AMONG AGES 30 TO 34 YEARS
99.4/ 100
METRIC RATING
29th/ 347
METRIC RANK
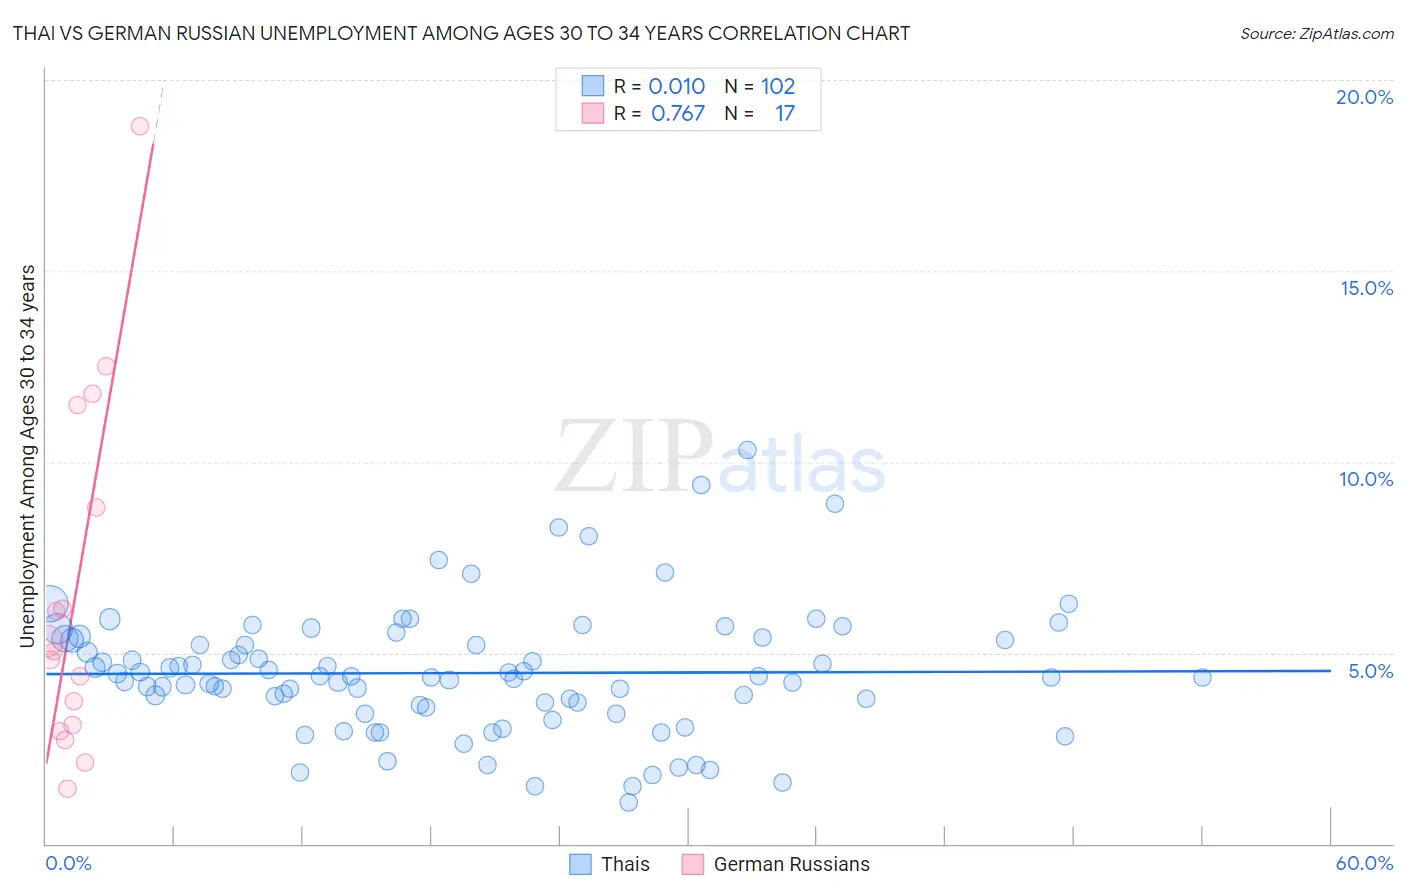
Thai vs German Russian Unemployment Among Ages 30 to 34 years Correlation Chart
The statistical analysis conducted on geographies consisting of 441,217,021 people shows no correlation between the proportion of Thais and unemployment rate among population between the ages 30 and 34 in the United States with a correlation coefficient (R) of 0.010 and weighted average of 4.7%. Similarly, the statistical analysis conducted on geographies consisting of 94,856,577 people shows a strong positive correlation between the proportion of German Russians and unemployment rate among population between the ages 30 and 34 in the United States with a correlation coefficient (R) of 0.767 and weighted average of 5.0%, a difference of 5.5%.
Unemployment Among Ages 30 to 34 years Correlation Summary
| Measurement | Thai | German Russian |
| Minimum | 1.1% | 1.5% |
| Maximum | 10.3% | 18.8% |
| Range | 9.2% | 17.3% |
| Mean | 4.5% | 6.5% |
| Median | 4.4% | 5.0% |
| Interquartile 25% (IQ1) | 3.6% | 3.0% |
| Interquartile 75% (IQ3) | 5.3% | 10.2% |
| Interquartile Range (IQR) | 1.7% | 7.1% |
| Standard Deviation (Sample) | 1.7% | 4.7% |
| Standard Deviation (Population) | 1.6% | 4.5% |
Similar Demographics by Unemployment Among Ages 30 to 34 years
Demographics Similar to Thais by Unemployment Among Ages 30 to 34 years
In terms of unemployment among ages 30 to 34 years, the demographic groups most similar to Thais are Immigrants from Eritrea (4.7%, a difference of 0.18%), Immigrants from Bosnia and Herzegovina (4.7%, a difference of 0.20%), Venezuelan (4.7%, a difference of 0.43%), Bulgarian (4.7%, a difference of 0.49%), and Tongan (4.8%, a difference of 0.67%).
| Demographics | Rating | Rank | Unemployment Among Ages 30 to 34 years |
| Immigrants | India | 100.0 /100 | #1 | Exceptional 4.5% |
| Sudanese | 100.0 /100 | #2 | Exceptional 4.6% |
| Immigrants | Venezuela | 100.0 /100 | #3 | Exceptional 4.6% |
| Immigrants | Nepal | 100.0 /100 | #4 | Exceptional 4.7% |
| Venezuelans | 100.0 /100 | #5 | Exceptional 4.7% |
| Immigrants | Bosnia and Herzegovina | 100.0 /100 | #6 | Exceptional 4.7% |
| Thais | 100.0 /100 | #7 | Exceptional 4.7% |
| Immigrants | Eritrea | 100.0 /100 | #8 | Exceptional 4.7% |
| Bulgarians | 99.9 /100 | #9 | Exceptional 4.7% |
| Tongans | 99.9 /100 | #10 | Exceptional 4.8% |
| Immigrants | Bolivia | 99.9 /100 | #11 | Exceptional 4.8% |
| Filipinos | 99.9 /100 | #12 | Exceptional 4.8% |
| Cambodians | 99.9 /100 | #13 | Exceptional 4.8% |
| Luxembourgers | 99.9 /100 | #14 | Exceptional 4.8% |
| Okinawans | 99.9 /100 | #15 | Exceptional 4.8% |
Demographics Similar to German Russians by Unemployment Among Ages 30 to 34 years
In terms of unemployment among ages 30 to 34 years, the demographic groups most similar to German Russians are Immigrants from Cuba (5.0%, a difference of 0.020%), Norwegian (5.0%, a difference of 0.020%), Somali (5.0%, a difference of 0.11%), Immigrants from Zaire (5.0%, a difference of 0.15%), and Immigrants from Saudi Arabia (5.0%, a difference of 0.25%).
| Demographics | Rating | Rank | Unemployment Among Ages 30 to 34 years |
| Immigrants | South Central Asia | 99.8 /100 | #22 | Exceptional 4.9% |
| Hmong | 99.8 /100 | #23 | Exceptional 4.9% |
| Ugandans | 99.7 /100 | #24 | Exceptional 4.9% |
| Immigrants | Singapore | 99.5 /100 | #25 | Exceptional 5.0% |
| Immigrants | Kuwait | 99.5 /100 | #26 | Exceptional 5.0% |
| Danes | 99.5 /100 | #27 | Exceptional 5.0% |
| Immigrants | Cuba | 99.4 /100 | #28 | Exceptional 5.0% |
| German Russians | 99.4 /100 | #29 | Exceptional 5.0% |
| Norwegians | 99.4 /100 | #30 | Exceptional 5.0% |
| Somalis | 99.3 /100 | #31 | Exceptional 5.0% |
| Immigrants | Zaire | 99.3 /100 | #32 | Exceptional 5.0% |
| Immigrants | Saudi Arabia | 99.3 /100 | #33 | Exceptional 5.0% |
| Latvians | 99.3 /100 | #34 | Exceptional 5.0% |
| Immigrants | Ethiopia | 99.2 /100 | #35 | Exceptional 5.0% |
| Czechs | 99.2 /100 | #36 | Exceptional 5.0% |