Tohono O'odham vs Chilean Female Unemployment
COMPARE
Tohono O'odham
Chilean
Female Unemployment
Female Unemployment Comparison
Tohono O'odham
Chileans
7.7%
FEMALE UNEMPLOYMENT
0.0/ 100
METRIC RATING
338th/ 347
METRIC RANK
5.1%
FEMALE UNEMPLOYMENT
85.8/ 100
METRIC RATING
128th/ 347
METRIC RANK
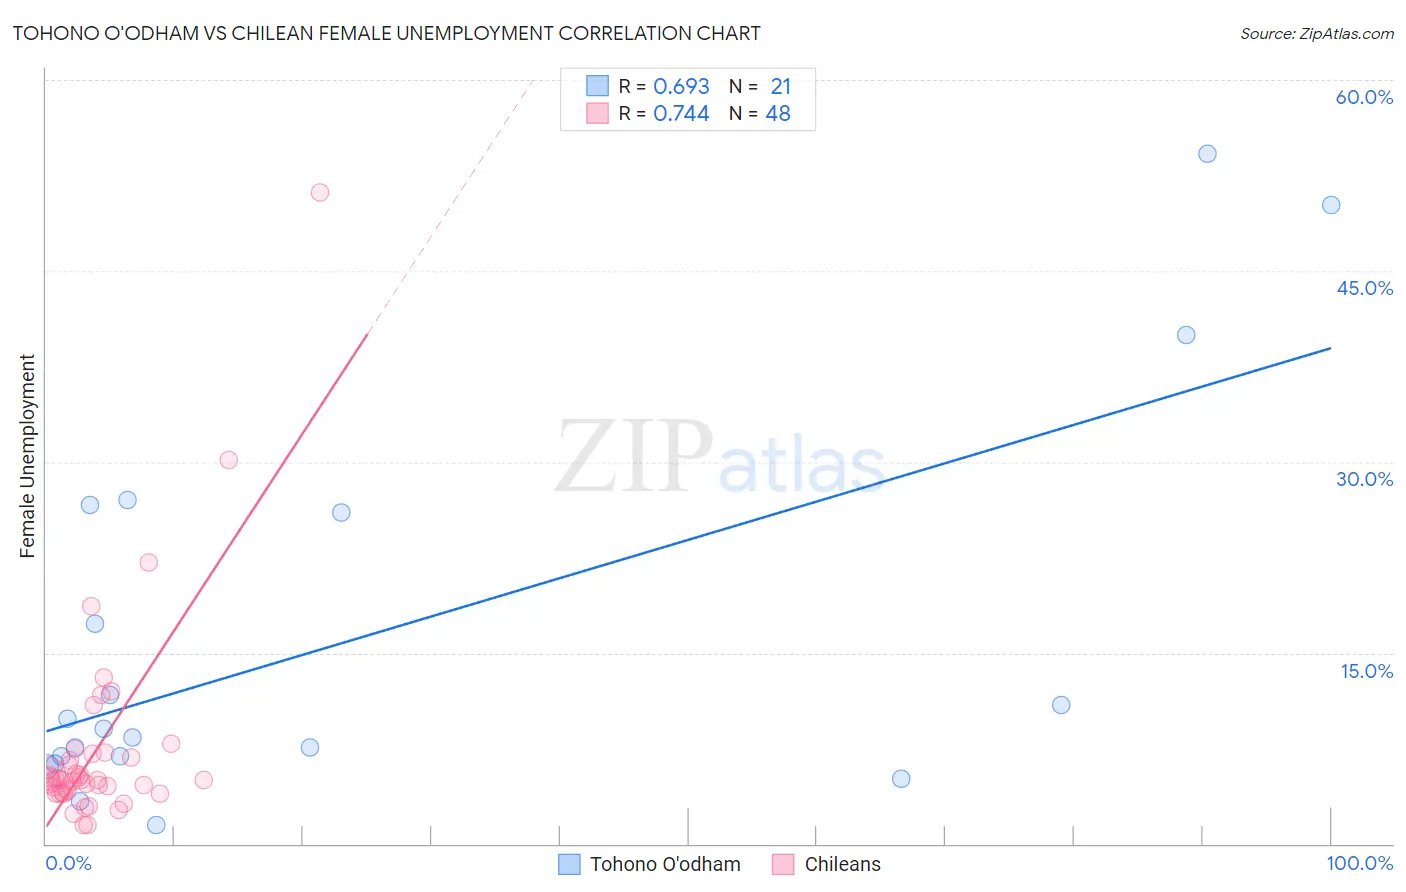
Tohono O'odham vs Chilean Female Unemployment Correlation Chart
The statistical analysis conducted on geographies consisting of 58,685,659 people shows a significant positive correlation between the proportion of Tohono O'odham and unemploymnet rate among females in the United States with a correlation coefficient (R) of 0.693 and weighted average of 7.7%. Similarly, the statistical analysis conducted on geographies consisting of 256,253,866 people shows a strong positive correlation between the proportion of Chileans and unemploymnet rate among females in the United States with a correlation coefficient (R) of 0.744 and weighted average of 5.1%, a difference of 51.4%.
Female Unemployment Correlation Summary
| Measurement | Tohono O'odham | Chilean |
| Minimum | 1.5% | 1.5% |
| Maximum | 54.2% | 51.2% |
| Range | 52.7% | 49.7% |
| Mean | 16.3% | 7.5% |
| Median | 9.0% | 5.0% |
| Interquartile 25% (IQ1) | 6.6% | 4.1% |
| Interquartile 75% (IQ3) | 26.3% | 6.9% |
| Interquartile Range (IQR) | 19.8% | 2.8% |
| Standard Deviation (Sample) | 15.4% | 8.3% |
| Standard Deviation (Population) | 15.0% | 8.2% |
Similar Demographics by Female Unemployment
Demographics Similar to Tohono O'odham by Female Unemployment
In terms of female unemployment, the demographic groups most similar to Tohono O'odham are Immigrants from Yemen (7.8%, a difference of 1.2%), Hopi (8.1%, a difference of 4.5%), Inupiat (8.2%, a difference of 5.3%), Navajo (7.3%, a difference of 6.3%), and Immigrants from Dominican Republic (7.2%, a difference of 7.3%).
| Demographics | Rating | Rank | Female Unemployment |
| Paiute | 0.0 /100 | #331 | Tragic 6.8% |
| Sioux | 0.0 /100 | #332 | Tragic 7.0% |
| Menominee | 0.0 /100 | #333 | Tragic 7.0% |
| Immigrants | Armenia | 0.0 /100 | #334 | Tragic 7.1% |
| Dominicans | 0.0 /100 | #335 | Tragic 7.2% |
| Immigrants | Dominican Republic | 0.0 /100 | #336 | Tragic 7.2% |
| Navajo | 0.0 /100 | #337 | Tragic 7.3% |
| Tohono O'odham | 0.0 /100 | #338 | Tragic 7.7% |
| Immigrants | Yemen | 0.0 /100 | #339 | Tragic 7.8% |
| Hopi | 0.0 /100 | #340 | Tragic 8.1% |
| Inupiat | 0.0 /100 | #341 | Tragic 8.2% |
| Puerto Ricans | 0.0 /100 | #342 | Tragic 8.3% |
| Arapaho | 0.0 /100 | #343 | Tragic 8.8% |
| Pima | 0.0 /100 | #344 | Tragic 9.3% |
| Yuman | 0.0 /100 | #345 | Tragic 9.6% |
Demographics Similar to Chileans by Female Unemployment
In terms of female unemployment, the demographic groups most similar to Chileans are Ethiopian (5.1%, a difference of 0.010%), Immigrants from Hungary (5.1%, a difference of 0.030%), Maltese (5.1%, a difference of 0.040%), Immigrants from Ethiopia (5.1%, a difference of 0.060%), and Immigrants from Korea (5.1%, a difference of 0.070%).
| Demographics | Rating | Rank | Female Unemployment |
| Immigrants | Western Europe | 88.1 /100 | #121 | Excellent 5.1% |
| Immigrants | Germany | 87.6 /100 | #122 | Excellent 5.1% |
| Immigrants | South Africa | 87.6 /100 | #123 | Excellent 5.1% |
| Immigrants | Europe | 87.2 /100 | #124 | Excellent 5.1% |
| Basques | 86.5 /100 | #125 | Excellent 5.1% |
| Immigrants | Korea | 86.3 /100 | #126 | Excellent 5.1% |
| Immigrants | Hungary | 86.0 /100 | #127 | Excellent 5.1% |
| Chileans | 85.8 /100 | #128 | Excellent 5.1% |
| Ethiopians | 85.7 /100 | #129 | Excellent 5.1% |
| Maltese | 85.5 /100 | #130 | Excellent 5.1% |
| Immigrants | Ethiopia | 85.4 /100 | #131 | Excellent 5.1% |
| Immigrants | Sri Lanka | 85.0 /100 | #132 | Excellent 5.1% |
| Immigrants | Hong Kong | 84.8 /100 | #133 | Excellent 5.1% |
| Immigrants | Eritrea | 84.6 /100 | #134 | Excellent 5.1% |
| Immigrants | Latvia | 84.6 /100 | #135 | Excellent 5.1% |