White/Caucasian vs Irish Unemployment Among Women with Children Under 6 years
COMPARE
White/Caucasian
Irish
Unemployment Among Women with Children Under 6 years
Unemployment Among Women with Children Under 6 years Comparison
Whites/Caucasians
Irish
8.4%
UNEMPLOYMENT AMONG WOMEN WITH CHILDREN UNDER 6 YEARS
0.3/ 100
METRIC RATING
260th/ 347
METRIC RANK
8.1%
UNEMPLOYMENT AMONG WOMEN WITH CHILDREN UNDER 6 YEARS
2.7/ 100
METRIC RATING
239th/ 347
METRIC RANK
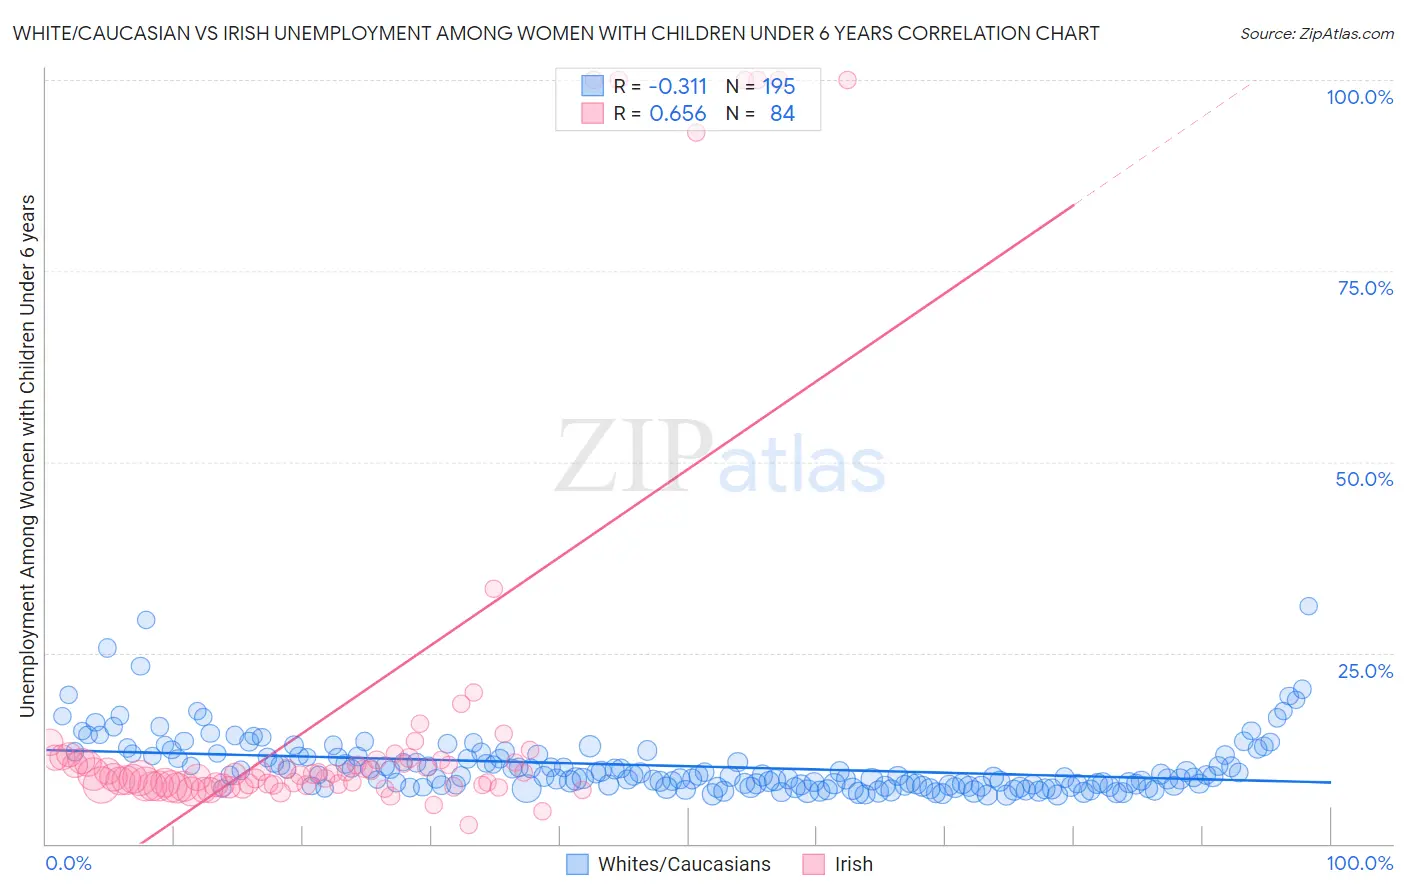
White/Caucasian vs Irish Unemployment Among Women with Children Under 6 years Correlation Chart
The statistical analysis conducted on geographies consisting of 381,009,459 people shows a mild negative correlation between the proportion of Whites/Caucasians and unemployment rate among women with children under the age of 6 in the United States with a correlation coefficient (R) of -0.311 and weighted average of 8.4%. Similarly, the statistical analysis conducted on geographies consisting of 378,985,462 people shows a significant positive correlation between the proportion of Irish and unemployment rate among women with children under the age of 6 in the United States with a correlation coefficient (R) of 0.656 and weighted average of 8.1%, a difference of 3.3%.
Unemployment Among Women with Children Under 6 years Correlation Summary
| Measurement | White/Caucasian | Irish |
| Minimum | 6.3% | 2.5% |
| Maximum | 31.1% | 100.0% |
| Range | 24.8% | 97.5% |
| Mean | 10.2% | 16.9% |
| Median | 8.9% | 9.1% |
| Interquartile 25% (IQ1) | 7.6% | 7.7% |
| Interquartile 75% (IQ3) | 11.5% | 11.0% |
| Interquartile Range (IQR) | 3.9% | 3.3% |
| Standard Deviation (Sample) | 3.9% | 25.2% |
| Standard Deviation (Population) | 3.9% | 25.0% |
Similar Demographics by Unemployment Among Women with Children Under 6 years
Demographics Similar to Whites/Caucasians by Unemployment Among Women with Children Under 6 years
In terms of unemployment among women with children under 6 years, the demographic groups most similar to Whites/Caucasians are Barbadian (8.3%, a difference of 0.26%), Immigrants from Liberia (8.4%, a difference of 0.28%), West Indian (8.4%, a difference of 0.29%), Scotch-Irish (8.4%, a difference of 0.32%), and Honduran (8.4%, a difference of 0.35%).
| Demographics | Rating | Rank | Unemployment Among Women with Children Under 6 years |
| Immigrants | Guyana | 0.8 /100 | #253 | Tragic 8.2% |
| Immigrants | Caribbean | 0.7 /100 | #254 | Tragic 8.3% |
| Immigrants | Portugal | 0.6 /100 | #255 | Tragic 8.3% |
| Celtics | 0.6 /100 | #256 | Tragic 8.3% |
| British West Indians | 0.5 /100 | #257 | Tragic 8.3% |
| Immigrants | Ghana | 0.5 /100 | #258 | Tragic 8.3% |
| Barbadians | 0.4 /100 | #259 | Tragic 8.3% |
| Whites/Caucasians | 0.3 /100 | #260 | Tragic 8.4% |
| Immigrants | Liberia | 0.3 /100 | #261 | Tragic 8.4% |
| West Indians | 0.3 /100 | #262 | Tragic 8.4% |
| Scotch-Irish | 0.3 /100 | #263 | Tragic 8.4% |
| Hondurans | 0.3 /100 | #264 | Tragic 8.4% |
| French Canadians | 0.3 /100 | #265 | Tragic 8.4% |
| Immigrants | Honduras | 0.3 /100 | #266 | Tragic 8.4% |
| Belizeans | 0.2 /100 | #267 | Tragic 8.4% |
Demographics Similar to Irish by Unemployment Among Women with Children Under 6 years
In terms of unemployment among women with children under 6 years, the demographic groups most similar to Irish are Immigrants from El Salvador (8.1%, a difference of 0.070%), Liberian (8.1%, a difference of 0.10%), Dutch (8.1%, a difference of 0.16%), Immigrants from Middle Africa (8.1%, a difference of 0.26%), and Immigrants from Costa Rica (8.0%, a difference of 0.65%).
| Demographics | Rating | Rank | Unemployment Among Women with Children Under 6 years |
| Welsh | 5.0 /100 | #232 | Tragic 8.0% |
| Immigrants | Trinidad and Tobago | 4.8 /100 | #233 | Tragic 8.0% |
| Kiowa | 4.4 /100 | #234 | Tragic 8.0% |
| Comanche | 4.3 /100 | #235 | Tragic 8.0% |
| Immigrants | Barbados | 4.2 /100 | #236 | Tragic 8.0% |
| Immigrants | Costa Rica | 4.1 /100 | #237 | Tragic 8.0% |
| Immigrants | Middle Africa | 3.2 /100 | #238 | Tragic 8.1% |
| Irish | 2.7 /100 | #239 | Tragic 8.1% |
| Immigrants | El Salvador | 2.6 /100 | #240 | Tragic 8.1% |
| Liberians | 2.6 /100 | #241 | Tragic 8.1% |
| Dutch | 2.5 /100 | #242 | Tragic 8.1% |
| Hawaiians | 1.8 /100 | #243 | Tragic 8.2% |
| French | 1.7 /100 | #244 | Tragic 8.2% |
| Native Hawaiians | 1.7 /100 | #245 | Tragic 8.2% |
| Central Americans | 1.4 /100 | #246 | Tragic 8.2% |