Yaqui vs Immigrants from Korea Male Unemployment
COMPARE
Yaqui
Immigrants from Korea
Male Unemployment
Male Unemployment Comparison
Yaqui
Immigrants from Korea
5.7%
MALE UNEMPLOYMENT
0.7/ 100
METRIC RATING
245th/ 347
METRIC RANK
4.9%
MALE UNEMPLOYMENT
99.1/ 100
METRIC RATING
44th/ 347
METRIC RANK
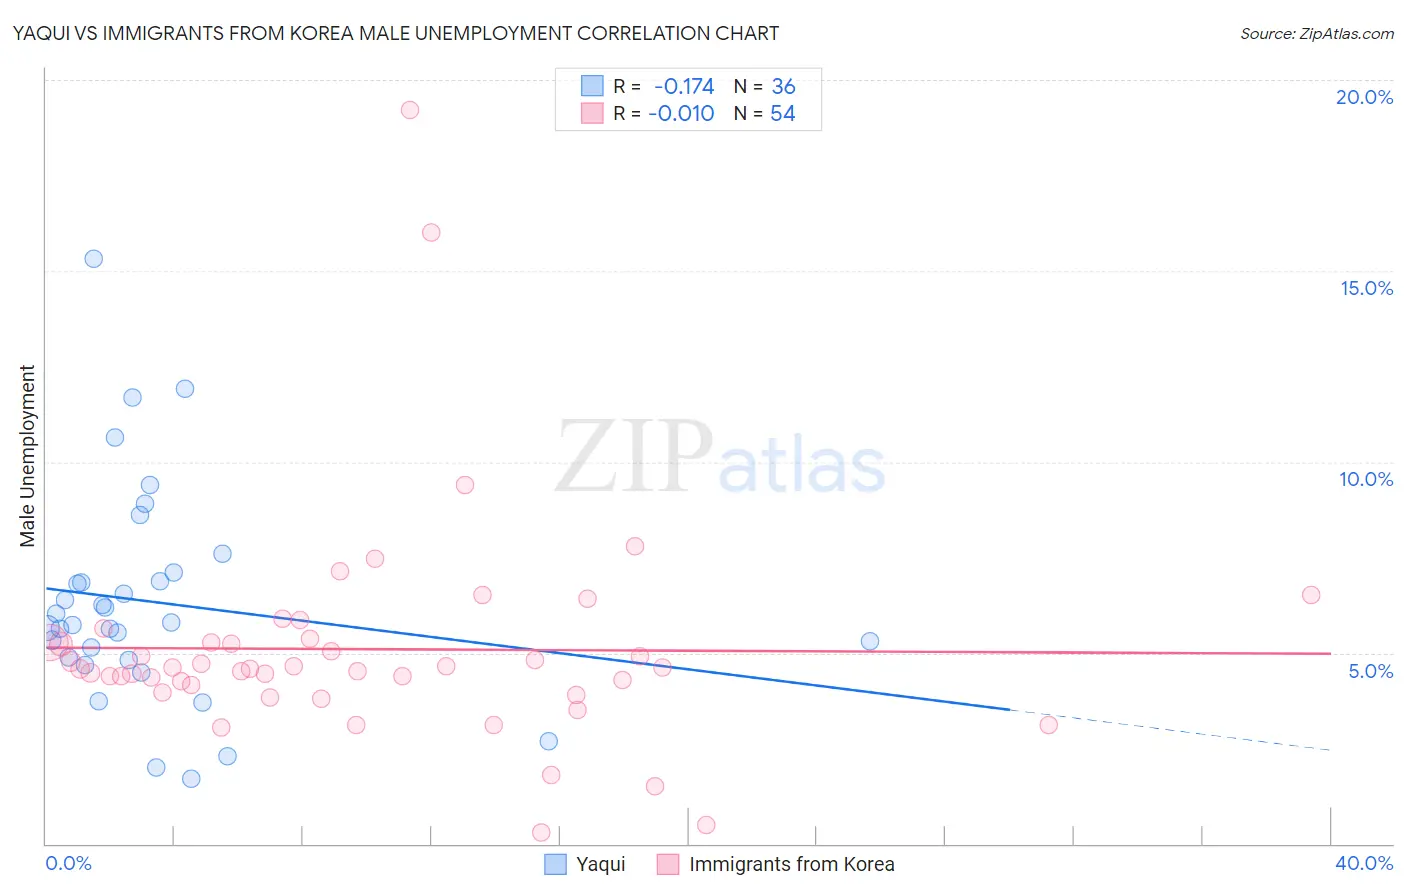
Yaqui vs Immigrants from Korea Male Unemployment Correlation Chart
The statistical analysis conducted on geographies consisting of 107,561,387 people shows a poor negative correlation between the proportion of Yaqui and unemployment rate among males in the United States with a correlation coefficient (R) of -0.174 and weighted average of 5.7%. Similarly, the statistical analysis conducted on geographies consisting of 414,464,791 people shows no correlation between the proportion of Immigrants from Korea and unemployment rate among males in the United States with a correlation coefficient (R) of -0.010 and weighted average of 4.9%, a difference of 15.2%.
Male Unemployment Correlation Summary
| Measurement | Yaqui | Immigrants from Korea |
| Minimum | 1.7% | 0.30% |
| Maximum | 15.3% | 19.2% |
| Range | 13.6% | 18.9% |
| Mean | 6.3% | 5.1% |
| Median | 5.8% | 4.6% |
| Interquartile 25% (IQ1) | 4.8% | 4.2% |
| Interquartile 75% (IQ3) | 7.0% | 5.3% |
| Interquartile Range (IQR) | 2.1% | 1.1% |
| Standard Deviation (Sample) | 2.8% | 3.0% |
| Standard Deviation (Population) | 2.8% | 2.9% |
Similar Demographics by Male Unemployment
Demographics Similar to Yaqui by Male Unemployment
In terms of male unemployment, the demographic groups most similar to Yaqui are Iroquois (5.7%, a difference of 0.090%), Immigrants from El Salvador (5.7%, a difference of 0.17%), Hawaiian (5.7%, a difference of 0.19%), Bangladeshi (5.7%, a difference of 0.21%), and Ottawa (5.7%, a difference of 0.50%).
| Demographics | Rating | Rank | Male Unemployment |
| Native Hawaiians | 1.1 /100 | #238 | Tragic 5.6% |
| Immigrants | Guatemala | 1.1 /100 | #239 | Tragic 5.6% |
| Immigrants | Cameroon | 1.0 /100 | #240 | Tragic 5.6% |
| Salvadorans | 1.0 /100 | #241 | Tragic 5.7% |
| Ottawa | 0.9 /100 | #242 | Tragic 5.7% |
| Bangladeshis | 0.8 /100 | #243 | Tragic 5.7% |
| Immigrants | El Salvador | 0.7 /100 | #244 | Tragic 5.7% |
| Yaqui | 0.7 /100 | #245 | Tragic 5.7% |
| Iroquois | 0.6 /100 | #246 | Tragic 5.7% |
| Hawaiians | 0.6 /100 | #247 | Tragic 5.7% |
| Marshallese | 0.5 /100 | #248 | Tragic 5.7% |
| Cree | 0.4 /100 | #249 | Tragic 5.7% |
| Immigrants | Bahamas | 0.4 /100 | #250 | Tragic 5.7% |
| Spanish Americans | 0.3 /100 | #251 | Tragic 5.7% |
| Mexicans | 0.2 /100 | #252 | Tragic 5.8% |
Demographics Similar to Immigrants from Korea by Male Unemployment
In terms of male unemployment, the demographic groups most similar to Immigrants from Korea are Immigrants from Zimbabwe (4.9%, a difference of 0.15%), Immigrants from Japan (4.9%, a difference of 0.18%), Bhutanese (4.9%, a difference of 0.24%), Immigrants from Belgium (4.9%, a difference of 0.29%), and Chinese (4.9%, a difference of 0.31%).
| Demographics | Rating | Rank | Male Unemployment |
| Scotch-Irish | 99.4 /100 | #37 | Exceptional 4.9% |
| Immigrants | Bosnia and Herzegovina | 99.4 /100 | #38 | Exceptional 4.9% |
| Burmese | 99.3 /100 | #39 | Exceptional 4.9% |
| Northern Europeans | 99.3 /100 | #40 | Exceptional 4.9% |
| Chinese | 99.3 /100 | #41 | Exceptional 4.9% |
| Immigrants | Belgium | 99.2 /100 | #42 | Exceptional 4.9% |
| Immigrants | Japan | 99.2 /100 | #43 | Exceptional 4.9% |
| Immigrants | Korea | 99.1 /100 | #44 | Exceptional 4.9% |
| Immigrants | Zimbabwe | 99.0 /100 | #45 | Exceptional 4.9% |
| Bhutanese | 98.9 /100 | #46 | Exceptional 4.9% |
| Austrians | 98.9 /100 | #47 | Exceptional 4.9% |
| Immigrants | Scotland | 98.9 /100 | #48 | Exceptional 4.9% |
| Poles | 98.9 /100 | #49 | Exceptional 4.9% |
| Croatians | 98.9 /100 | #50 | Exceptional 4.9% |
| Slovenes | 98.8 /100 | #51 | Exceptional 5.0% |