Zip Codes with the Highest Percentage of Population Employed in Accommodation & Food Services in Harrisonburg, VA
RELATED REPORTS & OPTIONS
Accommodation & Food Services
Harrisonburg
Compare Zip Codes
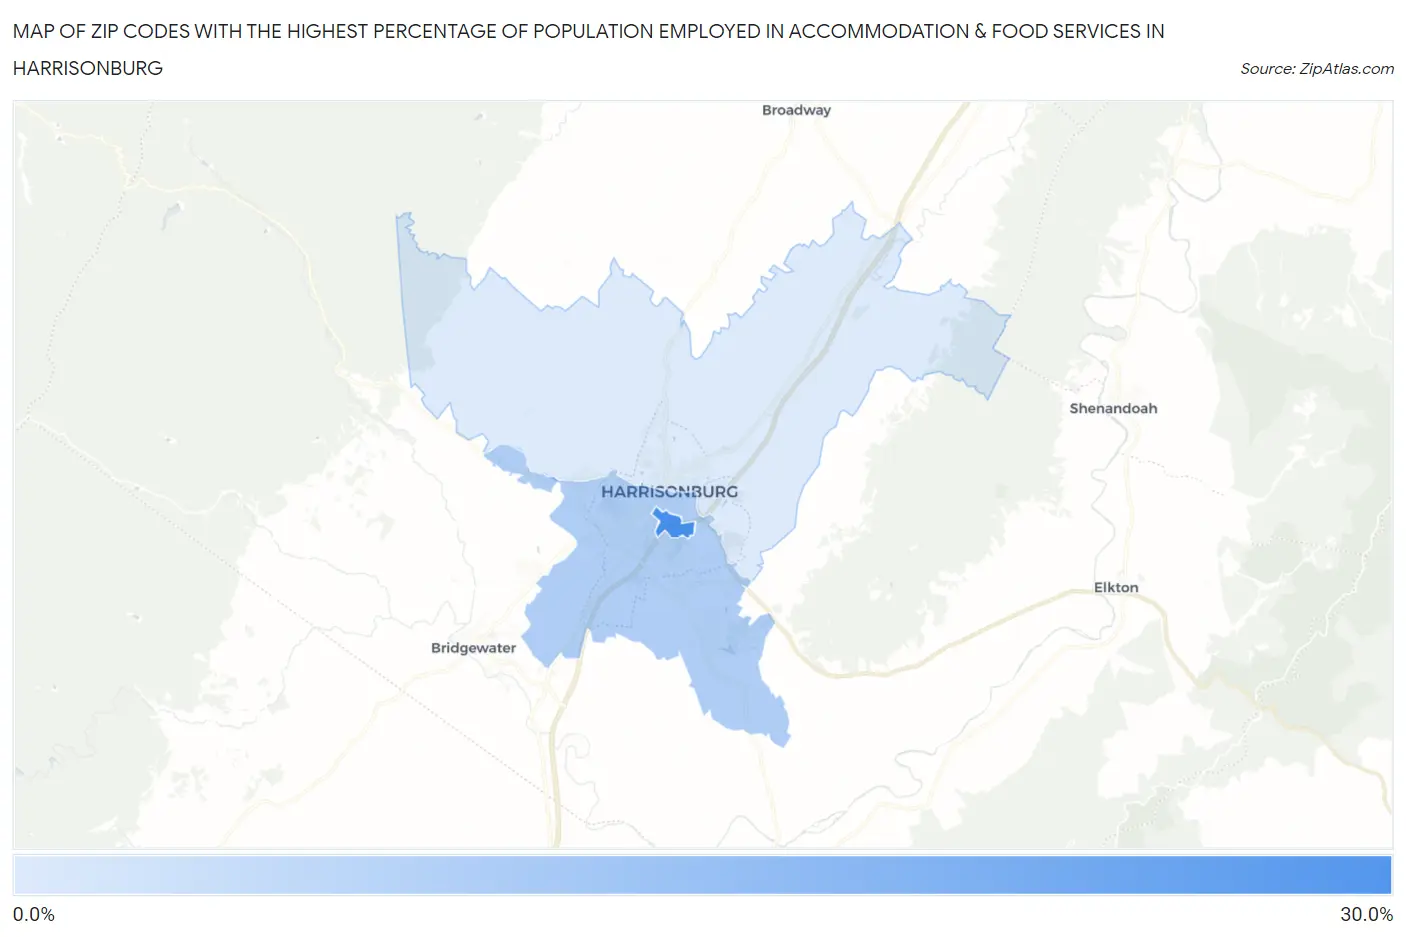
Map of Zip Codes with the Highest Percentage of Population Employed in Accommodation & Food Services in Harrisonburg
5.9%
27.4%
Zip Codes with the Highest Percentage of Population Employed in Accommodation & Food Services in Harrisonburg, VA
| Zip Code | % Employed | vs State | vs National | |
| 1. | 22807 | 27.4% | 6.4%(+21.0)#10 | 6.9%(+20.6)#407 |
| 2. | 22801 | 12.2% | 6.4%(+5.79)#75 | 6.9%(+5.35)#2,693 |
| 3. | 22802 | 5.9% | 6.4%(-0.511)#365 | 6.9%(-0.951)#13,675 |
1
Common Questions
What are the Top Zip Codes with the Highest Percentage of Population Employed in Accommodation & Food Services in Harrisonburg, VA?
Top Zip Codes with the Highest Percentage of Population Employed in Accommodation & Food Services in Harrisonburg, VA are:
What zip code has the Highest Percentage of Population Employed in Accommodation & Food Services in Harrisonburg, VA?
22807 has the Highest Percentage of Population Employed in Accommodation & Food Services in Harrisonburg, VA with 27.4%.
What is the Percentage of Population Employed in Accommodation & Food Services in Harrisonburg, VA?
Percentage of Population Employed in Accommodation & Food Services in Harrisonburg is 11.9%.
What is the Percentage of Population Employed in Accommodation & Food Services in Virginia?
Percentage of Population Employed in Accommodation & Food Services in Virginia is 6.4%.
What is the Percentage of Population Employed in Accommodation & Food Services in the United States?
Percentage of Population Employed in Accommodation & Food Services in the United States is 6.9%.