Alaskan Athabascan vs Immigrants from Colombia No Vehicles in Household
COMPARE
Alaskan Athabascan
Immigrants from Colombia
No Vehicles in Household
No Vehicles in Household Comparison
Alaskan Athabascans
Immigrants from Colombia
15.6%
NO VEHICLES IN HOUSEHOLD
0.0/ 100
METRIC RATING
312th/ 347
METRIC RANK
10.5%
NO VEHICLES IN HOUSEHOLD
44.1/ 100
METRIC RATING
181st/ 347
METRIC RANK
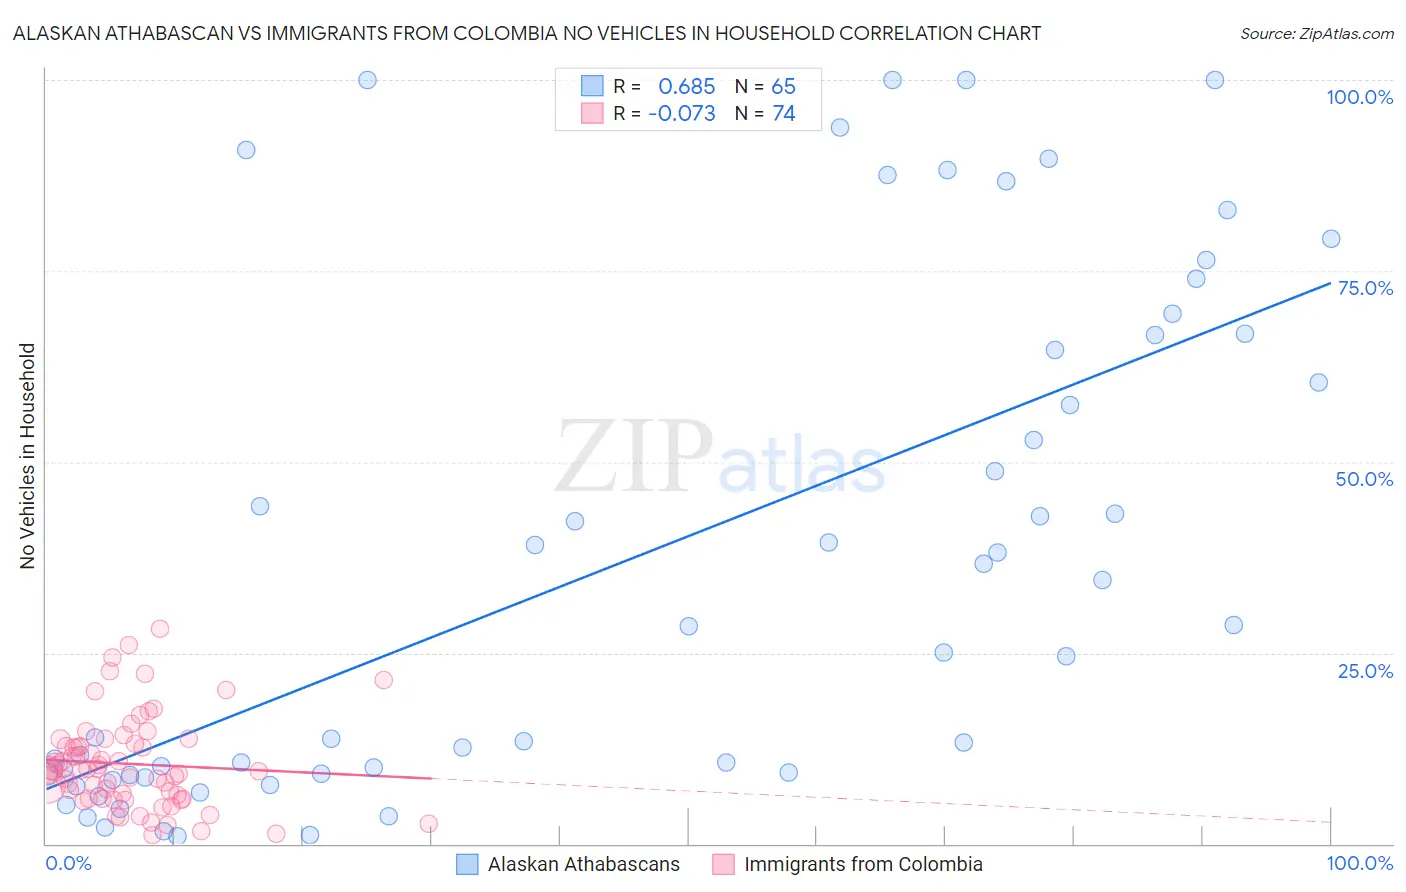
Alaskan Athabascan vs Immigrants from Colombia No Vehicles in Household Correlation Chart
The statistical analysis conducted on geographies consisting of 45,793,877 people shows a significant positive correlation between the proportion of Alaskan Athabascans and percentage of households with no vehicle available in the United States with a correlation coefficient (R) of 0.685 and weighted average of 15.6%. Similarly, the statistical analysis conducted on geographies consisting of 362,333,216 people shows a slight negative correlation between the proportion of Immigrants from Colombia and percentage of households with no vehicle available in the United States with a correlation coefficient (R) of -0.073 and weighted average of 10.5%, a difference of 48.7%.
No Vehicles in Household Correlation Summary
| Measurement | Alaskan Athabascan | Immigrants from Colombia |
| Minimum | 1.0% | 1.2% |
| Maximum | 100.0% | 28.2% |
| Range | 99.0% | 27.0% |
| Mean | 37.7% | 10.5% |
| Median | 28.5% | 9.7% |
| Interquartile 25% (IQ1) | 9.1% | 5.9% |
| Interquartile 75% (IQ3) | 66.7% | 13.1% |
| Interquartile Range (IQR) | 57.6% | 7.2% |
| Standard Deviation (Sample) | 33.1% | 5.9% |
| Standard Deviation (Population) | 32.8% | 5.9% |
Similar Demographics by No Vehicles in Household
Demographics Similar to Alaskan Athabascans by No Vehicles in Household
In terms of no vehicles in household, the demographic groups most similar to Alaskan Athabascans are Immigrants from Israel (15.6%, a difference of 0.15%), Tohono O'odham (15.6%, a difference of 0.15%), Cape Verdean (15.6%, a difference of 0.16%), Albanian (15.6%, a difference of 0.31%), and Cypriot (15.7%, a difference of 0.44%).
| Demographics | Rating | Rank | No Vehicles in Household |
| Immigrants | China | 0.0 /100 | #305 | Tragic 15.2% |
| Immigrants | Belize | 0.0 /100 | #306 | Tragic 15.4% |
| Immigrants | Haiti | 0.0 /100 | #307 | Tragic 15.4% |
| U.S. Virgin Islanders | 0.0 /100 | #308 | Tragic 15.4% |
| Puerto Ricans | 0.0 /100 | #309 | Tragic 15.5% |
| Cape Verdeans | 0.0 /100 | #310 | Tragic 15.6% |
| Immigrants | Israel | 0.0 /100 | #311 | Tragic 15.6% |
| Alaskan Athabascans | 0.0 /100 | #312 | Tragic 15.6% |
| Tohono O'odham | 0.0 /100 | #313 | Tragic 15.6% |
| Albanians | 0.0 /100 | #314 | Tragic 15.6% |
| Cypriots | 0.0 /100 | #315 | Tragic 15.7% |
| Ghanaians | 0.0 /100 | #316 | Tragic 16.4% |
| Immigrants | Ghana | 0.0 /100 | #317 | Tragic 16.6% |
| Immigrants | Belarus | 0.0 /100 | #318 | Tragic 16.7% |
| Alaska Natives | 0.0 /100 | #319 | Tragic 17.4% |
Demographics Similar to Immigrants from Colombia by No Vehicles in Household
In terms of no vehicles in household, the demographic groups most similar to Immigrants from Colombia are Immigrants from Bulgaria (10.5%, a difference of 0.040%), Native/Alaskan (10.5%, a difference of 0.060%), Arab (10.5%, a difference of 0.16%), Ethiopian (10.5%, a difference of 0.22%), and Immigrants from Nepal (10.5%, a difference of 0.23%).
| Demographics | Rating | Rank | No Vehicles in Household |
| Immigrants | Sudan | 50.0 /100 | #174 | Average 10.4% |
| Immigrants | Burma/Myanmar | 49.1 /100 | #175 | Average 10.4% |
| French American Indians | 49.1 /100 | #176 | Average 10.4% |
| Immigrants | El Salvador | 49.1 /100 | #177 | Average 10.4% |
| Immigrants | Ethiopia | 48.0 /100 | #178 | Average 10.4% |
| Ethiopians | 45.8 /100 | #179 | Average 10.5% |
| Arabs | 45.3 /100 | #180 | Average 10.5% |
| Immigrants | Colombia | 44.1 /100 | #181 | Average 10.5% |
| Immigrants | Bulgaria | 43.8 /100 | #182 | Average 10.5% |
| Natives/Alaskans | 43.7 /100 | #183 | Average 10.5% |
| Immigrants | Nepal | 42.4 /100 | #184 | Average 10.5% |
| South Americans | 41.9 /100 | #185 | Average 10.5% |
| German Russians | 40.6 /100 | #186 | Average 10.5% |
| Immigrants | Poland | 38.4 /100 | #187 | Fair 10.6% |
| Immigrants | Armenia | 37.5 /100 | #188 | Fair 10.6% |