Cuban vs Guyanese No Vehicles in Household
COMPARE
Cuban
Guyanese
No Vehicles in Household
No Vehicles in Household Comparison
Cubans
Guyanese
8.5%
NO VEHICLES IN HOUSEHOLD
99.5/ 100
METRIC RATING
74th/ 347
METRIC RANK
29.3%
NO VEHICLES IN HOUSEHOLD
0.0/ 100
METRIC RATING
338th/ 347
METRIC RANK
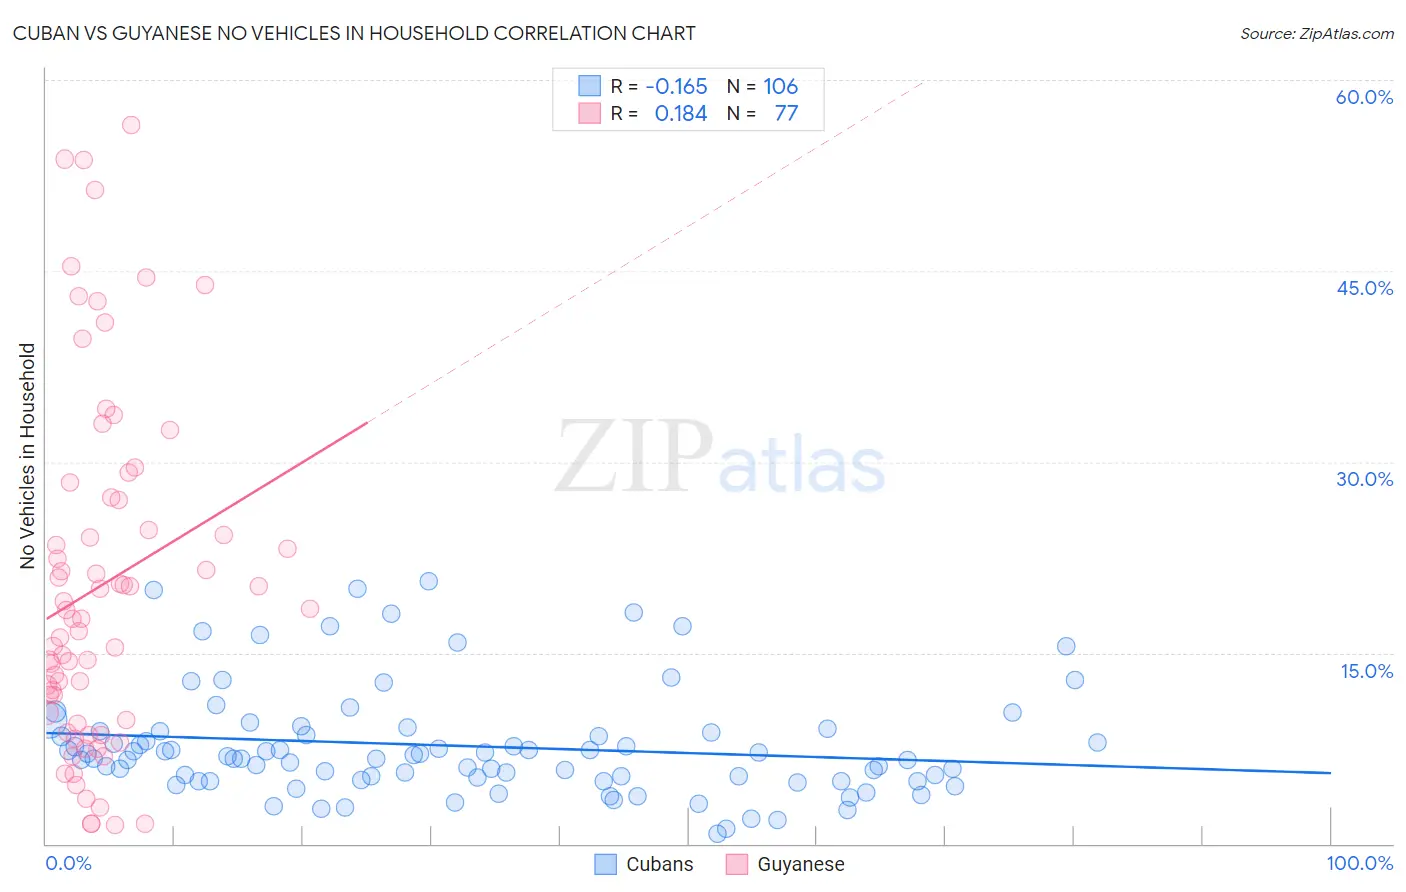
Cuban vs Guyanese No Vehicles in Household Correlation Chart
The statistical analysis conducted on geographies consisting of 447,809,570 people shows a poor negative correlation between the proportion of Cubans and percentage of households with no vehicle available in the United States with a correlation coefficient (R) of -0.165 and weighted average of 8.5%. Similarly, the statistical analysis conducted on geographies consisting of 176,563,698 people shows a poor positive correlation between the proportion of Guyanese and percentage of households with no vehicle available in the United States with a correlation coefficient (R) of 0.184 and weighted average of 29.3%, a difference of 244.4%.
No Vehicles in Household Correlation Summary
| Measurement | Cuban | Guyanese |
| Minimum | 0.80% | 1.4% |
| Maximum | 20.7% | 56.4% |
| Range | 19.9% | 55.0% |
| Mean | 7.7% | 20.3% |
| Median | 6.8% | 17.7% |
| Interquartile 25% (IQ1) | 5.0% | 9.6% |
| Interquartile 75% (IQ3) | 8.8% | 27.1% |
| Interquartile Range (IQR) | 3.8% | 17.6% |
| Standard Deviation (Sample) | 4.3% | 13.7% |
| Standard Deviation (Population) | 4.2% | 13.6% |
Similar Demographics by No Vehicles in Household
Demographics Similar to Cubans by No Vehicles in Household
In terms of no vehicles in household, the demographic groups most similar to Cubans are Jordanian (8.5%, a difference of 0.22%), Immigrants from Philippines (8.5%, a difference of 0.46%), Iranian (8.6%, a difference of 0.55%), Immigrants from South Central Asia (8.6%, a difference of 0.67%), and Portuguese (8.6%, a difference of 0.73%).
| Demographics | Rating | Rank | No Vehicles in Household |
| Immigrants | Scotland | 99.7 /100 | #67 | Exceptional 8.3% |
| Immigrants | Iran | 99.7 /100 | #68 | Exceptional 8.4% |
| Spaniards | 99.7 /100 | #69 | Exceptional 8.4% |
| Cajuns | 99.6 /100 | #70 | Exceptional 8.4% |
| Immigrants | Lebanon | 99.6 /100 | #71 | Exceptional 8.4% |
| Lithuanians | 99.6 /100 | #72 | Exceptional 8.4% |
| Poles | 99.6 /100 | #73 | Exceptional 8.4% |
| Cubans | 99.5 /100 | #74 | Exceptional 8.5% |
| Jordanians | 99.5 /100 | #75 | Exceptional 8.5% |
| Immigrants | Philippines | 99.5 /100 | #76 | Exceptional 8.5% |
| Iranians | 99.5 /100 | #77 | Exceptional 8.6% |
| Immigrants | South Central Asia | 99.5 /100 | #78 | Exceptional 8.6% |
| Portuguese | 99.5 /100 | #79 | Exceptional 8.6% |
| Bolivians | 99.4 /100 | #80 | Exceptional 8.6% |
| Tsimshian | 99.4 /100 | #81 | Exceptional 8.6% |
Demographics Similar to Guyanese by No Vehicles in Household
In terms of no vehicles in household, the demographic groups most similar to Guyanese are Dominican (29.4%, a difference of 0.36%), Immigrants from Barbados (29.5%, a difference of 0.59%), Immigrants from Guyana (29.5%, a difference of 0.64%), British West Indian (29.7%, a difference of 1.5%), and Inupiat (29.9%, a difference of 1.9%).
| Demographics | Rating | Rank | No Vehicles in Household |
| Trinidadians and Tobagonians | 0.0 /100 | #331 | Tragic 23.7% |
| Immigrants | Ecuador | 0.0 /100 | #332 | Tragic 23.8% |
| Immigrants | Trinidad and Tobago | 0.0 /100 | #333 | Tragic 24.6% |
| Immigrants | Bangladesh | 0.0 /100 | #334 | Tragic 25.8% |
| Barbadians | 0.0 /100 | #335 | Tragic 26.1% |
| Vietnamese | 0.0 /100 | #336 | Tragic 26.2% |
| Immigrants | Uzbekistan | 0.0 /100 | #337 | Tragic 26.7% |
| Guyanese | 0.0 /100 | #338 | Tragic 29.3% |
| Dominicans | 0.0 /100 | #339 | Tragic 29.4% |
| Immigrants | Barbados | 0.0 /100 | #340 | Tragic 29.5% |
| Immigrants | Guyana | 0.0 /100 | #341 | Tragic 29.5% |
| British West Indians | 0.0 /100 | #342 | Tragic 29.7% |
| Inupiat | 0.0 /100 | #343 | Tragic 29.9% |
| Immigrants | Dominican Republic | 0.0 /100 | #344 | Tragic 31.4% |
| Immigrants | St. Vincent and the Grenadines | 0.0 /100 | #345 | Tragic 35.4% |