Hmong vs Immigrants from Panama 4 or more Vehicles in Household
COMPARE
Hmong
Immigrants from Panama
4 or more Vehicles in Household
4 or more Vehicles in Household Comparison
Hmong
Immigrants from Panama
7.0%
4 OR MORE VEHICLES IN HOUSEHOLD
98.3/ 100
METRIC RATING
104th/ 347
METRIC RANK
5.7%
4 OR MORE VEHICLES IN HOUSEHOLD
1.5/ 100
METRIC RATING
254th/ 347
METRIC RANK
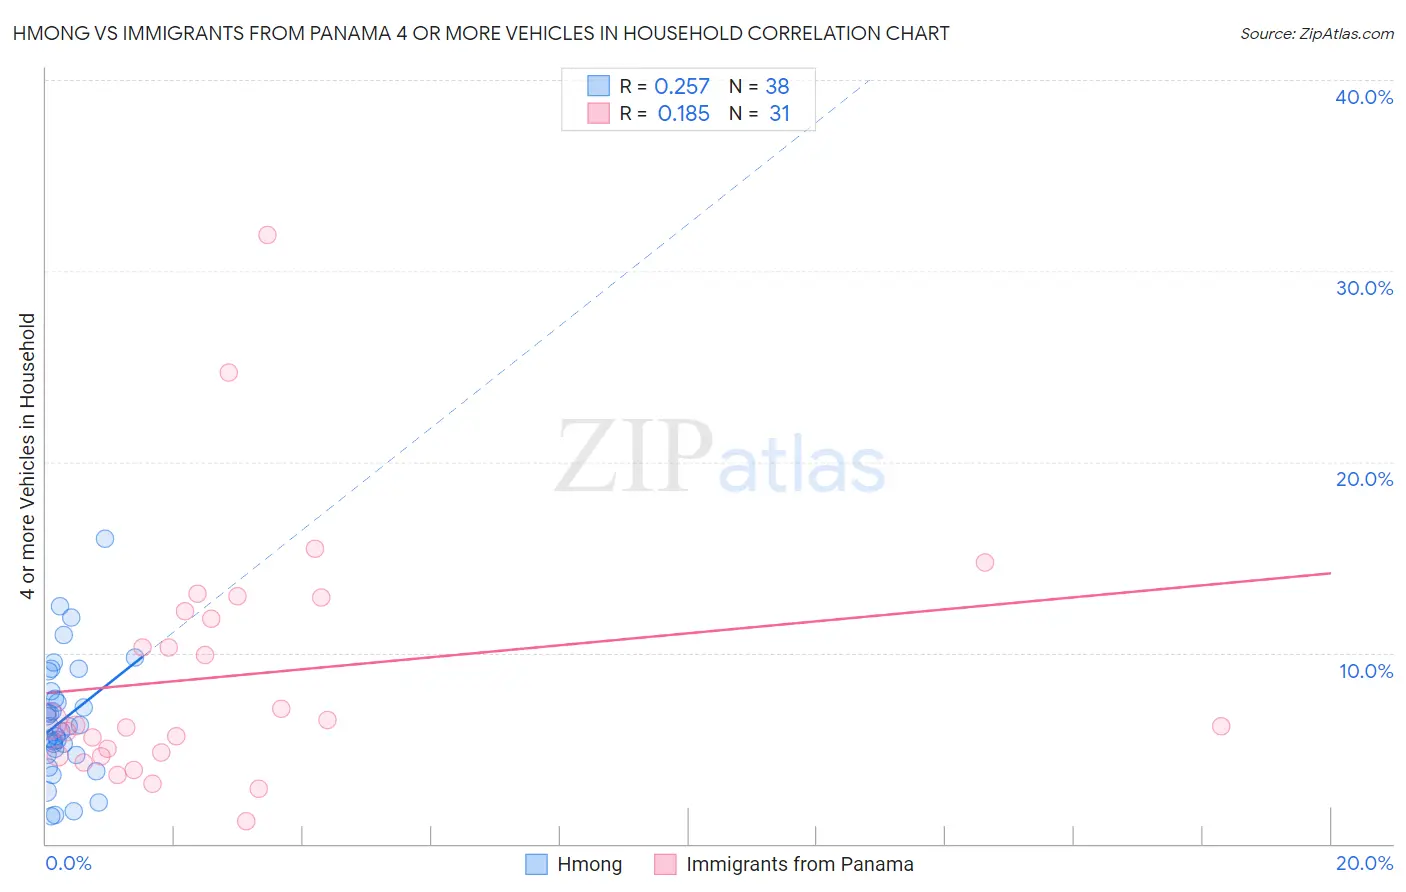
Hmong vs Immigrants from Panama 4 or more Vehicles in Household Correlation Chart
The statistical analysis conducted on geographies consisting of 24,663,855 people shows a weak positive correlation between the proportion of Hmong and percentage of households with 4 or more vehicles available in the United States with a correlation coefficient (R) of 0.257 and weighted average of 7.0%. Similarly, the statistical analysis conducted on geographies consisting of 220,402,511 people shows a poor positive correlation between the proportion of Immigrants from Panama and percentage of households with 4 or more vehicles available in the United States with a correlation coefficient (R) of 0.185 and weighted average of 5.7%, a difference of 23.3%.
4 or more Vehicles in Household Correlation Summary
| Measurement | Hmong | Immigrants from Panama |
| Minimum | 1.5% | 1.2% |
| Maximum | 16.0% | 31.9% |
| Range | 14.5% | 30.7% |
| Mean | 6.5% | 8.8% |
| Median | 6.1% | 6.2% |
| Interquartile 25% (IQ1) | 4.7% | 4.6% |
| Interquartile 75% (IQ3) | 8.0% | 12.2% |
| Interquartile Range (IQR) | 3.3% | 7.6% |
| Standard Deviation (Sample) | 3.1% | 6.5% |
| Standard Deviation (Population) | 3.1% | 6.4% |
Similar Demographics by 4 or more Vehicles in Household
Demographics Similar to Hmong by 4 or more Vehicles in Household
In terms of 4 or more vehicles in household, the demographic groups most similar to Hmong are German Russian (7.0%, a difference of 0.0%), Guatemalan (7.0%, a difference of 0.35%), Nicaraguan (7.0%, a difference of 0.36%), Blackfeet (7.0%, a difference of 0.48%), and Asian (7.0%, a difference of 0.49%).
| Demographics | Rating | Rank | 4 or more Vehicles in Household |
| Celtics | 99.1 /100 | #97 | Exceptional 7.1% |
| Irish | 99.0 /100 | #98 | Exceptional 7.1% |
| Seminole | 98.8 /100 | #99 | Exceptional 7.0% |
| Taiwanese | 98.7 /100 | #100 | Exceptional 7.0% |
| Pakistanis | 98.7 /100 | #101 | Exceptional 7.0% |
| Asians | 98.6 /100 | #102 | Exceptional 7.0% |
| Blackfeet | 98.6 /100 | #103 | Exceptional 7.0% |
| Hmong | 98.3 /100 | #104 | Exceptional 7.0% |
| German Russians | 98.3 /100 | #105 | Exceptional 7.0% |
| Guatemalans | 98.1 /100 | #106 | Exceptional 7.0% |
| Nicaraguans | 98.0 /100 | #107 | Exceptional 7.0% |
| French | 97.7 /100 | #108 | Exceptional 6.9% |
| Filipinos | 97.6 /100 | #109 | Exceptional 6.9% |
| Immigrants | Thailand | 97.0 /100 | #110 | Exceptional 6.9% |
| Aleuts | 97.0 /100 | #111 | Exceptional 6.9% |
Demographics Similar to Immigrants from Panama by 4 or more Vehicles in Household
In terms of 4 or more vehicles in household, the demographic groups most similar to Immigrants from Panama are Yup'ik (5.7%, a difference of 0.090%), Immigrants from Turkey (5.7%, a difference of 0.12%), Immigrants from Cuba (5.7%, a difference of 0.14%), Immigrants from Northern Africa (5.6%, a difference of 0.20%), and Immigrants from Lithuania (5.6%, a difference of 0.34%).
| Demographics | Rating | Rank | 4 or more Vehicles in Household |
| Immigrants | Ethiopia | 2.4 /100 | #247 | Tragic 5.7% |
| Immigrants | Eastern Africa | 2.4 /100 | #248 | Tragic 5.7% |
| Immigrants | Southern Europe | 2.3 /100 | #249 | Tragic 5.7% |
| Immigrants | Europe | 2.3 /100 | #250 | Tragic 5.7% |
| Ugandans | 2.2 /100 | #251 | Tragic 5.7% |
| Sub-Saharan Africans | 2.1 /100 | #252 | Tragic 5.7% |
| Immigrants | Cuba | 1.6 /100 | #253 | Tragic 5.7% |
| Immigrants | Panama | 1.5 /100 | #254 | Tragic 5.7% |
| Yup'ik | 1.5 /100 | #255 | Tragic 5.7% |
| Immigrants | Turkey | 1.5 /100 | #256 | Tragic 5.7% |
| Immigrants | Northern Africa | 1.4 /100 | #257 | Tragic 5.6% |
| Immigrants | Lithuania | 1.4 /100 | #258 | Tragic 5.6% |
| Immigrants | France | 1.3 /100 | #259 | Tragic 5.6% |
| Uruguayans | 1.3 /100 | #260 | Tragic 5.6% |
| Sudanese | 1.2 /100 | #261 | Tragic 5.6% |