Soviet Union vs Immigrants from Kuwait No Vehicles in Household
COMPARE
Soviet Union
Immigrants from Kuwait
No Vehicles in Household
No Vehicles in Household Comparison
Soviet Union
Immigrants from Kuwait
17.4%
NO VEHICLES IN HOUSEHOLD
0.0/ 100
METRIC RATING
320th/ 347
METRIC RANK
9.4%
NO VEHICLES IN HOUSEHOLD
95.1/ 100
METRIC RATING
111th/ 347
METRIC RANK
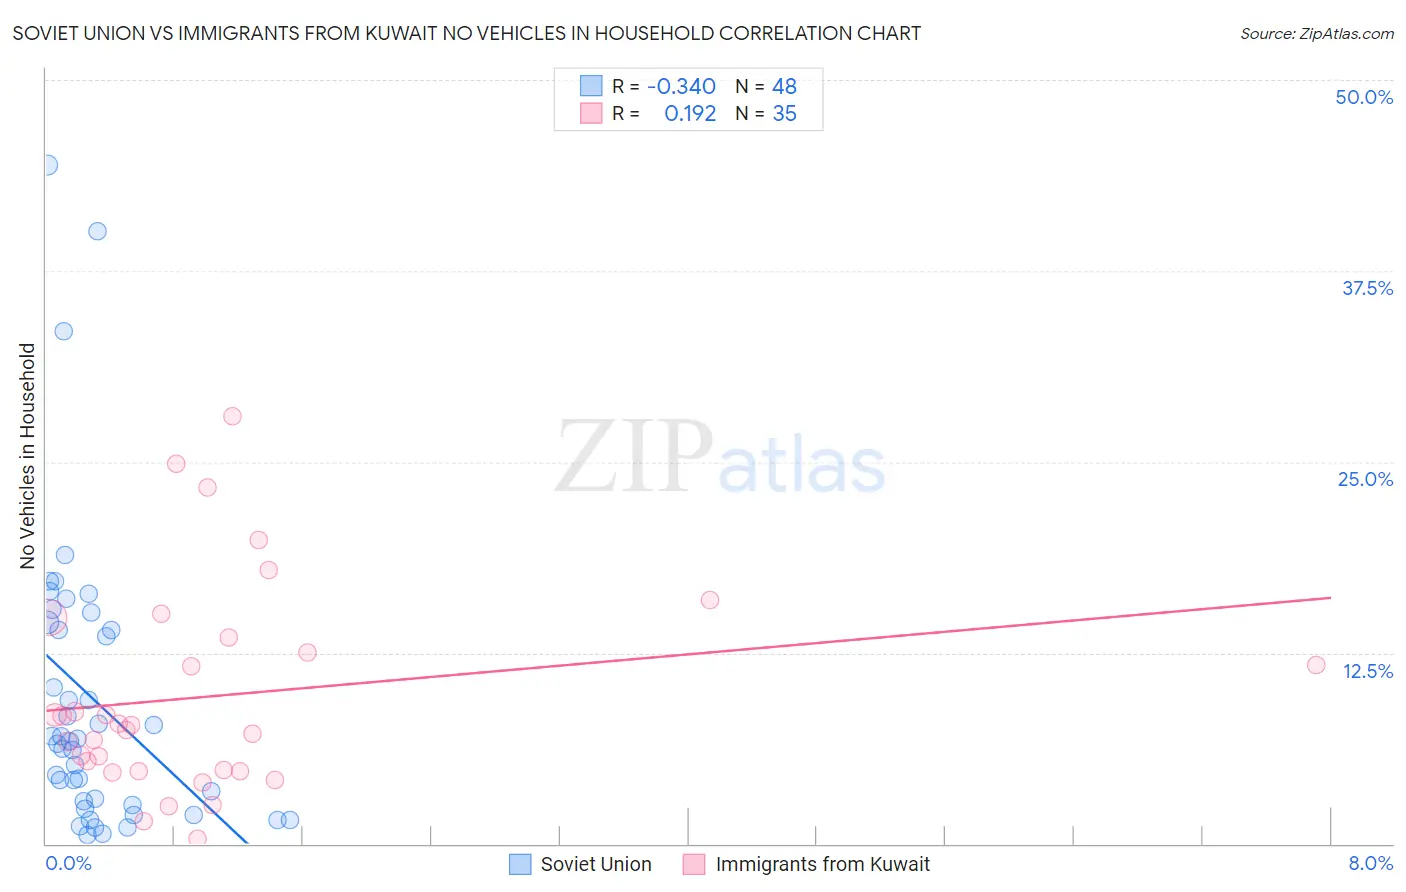
Soviet Union vs Immigrants from Kuwait No Vehicles in Household Correlation Chart
The statistical analysis conducted on geographies consisting of 43,483,285 people shows a mild negative correlation between the proportion of Soviet Union and percentage of households with no vehicle available in the United States with a correlation coefficient (R) of -0.340 and weighted average of 17.4%. Similarly, the statistical analysis conducted on geographies consisting of 136,758,114 people shows a poor positive correlation between the proportion of Immigrants from Kuwait and percentage of households with no vehicle available in the United States with a correlation coefficient (R) of 0.192 and weighted average of 9.4%, a difference of 86.2%.
No Vehicles in Household Correlation Summary
| Measurement | Soviet Union | Immigrants from Kuwait |
| Minimum | 0.54% | 0.29% |
| Maximum | 44.4% | 27.9% |
| Range | 43.9% | 27.7% |
| Mean | 9.5% | 9.7% |
| Median | 6.8% | 7.8% |
| Interquartile 25% (IQ1) | 2.7% | 4.8% |
| Interquartile 75% (IQ3) | 14.3% | 13.5% |
| Interquartile Range (IQR) | 11.6% | 8.8% |
| Standard Deviation (Sample) | 9.6% | 6.8% |
| Standard Deviation (Population) | 9.5% | 6.7% |
Similar Demographics by No Vehicles in Household
Demographics Similar to Soviet Union by No Vehicles in Household
In terms of no vehicles in household, the demographic groups most similar to Soviet Union are Alaska Native (17.4%, a difference of 0.16%), Jamaican (17.9%, a difference of 2.9%), Immigrants from Belarus (16.7%, a difference of 4.1%), Immigrants from Ghana (16.6%, a difference of 5.0%), and Immigrants from Cabo Verde (18.4%, a difference of 5.8%).
| Demographics | Rating | Rank | No Vehicles in Household |
| Tohono O'odham | 0.0 /100 | #313 | Tragic 15.6% |
| Albanians | 0.0 /100 | #314 | Tragic 15.6% |
| Cypriots | 0.0 /100 | #315 | Tragic 15.7% |
| Ghanaians | 0.0 /100 | #316 | Tragic 16.4% |
| Immigrants | Ghana | 0.0 /100 | #317 | Tragic 16.6% |
| Immigrants | Belarus | 0.0 /100 | #318 | Tragic 16.7% |
| Alaska Natives | 0.0 /100 | #319 | Tragic 17.4% |
| Soviet Union | 0.0 /100 | #320 | Tragic 17.4% |
| Jamaicans | 0.0 /100 | #321 | Tragic 17.9% |
| Immigrants | Cabo Verde | 0.0 /100 | #322 | Tragic 18.4% |
| Immigrants | Yemen | 0.0 /100 | #323 | Tragic 19.5% |
| Immigrants | Caribbean | 0.0 /100 | #324 | Tragic 19.6% |
| Senegalese | 0.0 /100 | #325 | Tragic 19.8% |
| Immigrants | West Indies | 0.0 /100 | #326 | Tragic 20.5% |
| Immigrants | Senegal | 0.0 /100 | #327 | Tragic 21.1% |
Demographics Similar to Immigrants from Kuwait by No Vehicles in Household
In terms of no vehicles in household, the demographic groups most similar to Immigrants from Kuwait are Armenian (9.4%, a difference of 0.090%), Immigrants from Netherlands (9.4%, a difference of 0.18%), Serbian (9.4%, a difference of 0.61%), Navajo (9.4%, a difference of 0.68%), and Japanese (9.4%, a difference of 0.74%).
| Demographics | Rating | Rank | No Vehicles in Household |
| Zimbabweans | 98.0 /100 | #104 | Exceptional 9.0% |
| Spanish Americans | 97.9 /100 | #105 | Exceptional 9.1% |
| Laotians | 97.8 /100 | #106 | Exceptional 9.1% |
| Hispanics or Latinos | 97.7 /100 | #107 | Exceptional 9.1% |
| Mexican American Indians | 97.6 /100 | #108 | Exceptional 9.1% |
| Maltese | 97.6 /100 | #109 | Exceptional 9.1% |
| Delaware | 97.2 /100 | #110 | Exceptional 9.2% |
| Immigrants | Kuwait | 95.1 /100 | #111 | Exceptional 9.4% |
| Armenians | 95.0 /100 | #112 | Exceptional 9.4% |
| Immigrants | Netherlands | 94.8 /100 | #113 | Exceptional 9.4% |
| Serbians | 94.3 /100 | #114 | Exceptional 9.4% |
| Navajo | 94.2 /100 | #115 | Exceptional 9.4% |
| Japanese | 94.1 /100 | #116 | Exceptional 9.4% |
| Chippewa | 93.8 /100 | #117 | Exceptional 9.4% |
| Greeks | 92.9 /100 | #118 | Exceptional 9.5% |