Cities with the Highest Percentage of Immigrants from Laos in the United States
RELATED REPORTS & OPTIONS
Laos
United States
Compare Cities
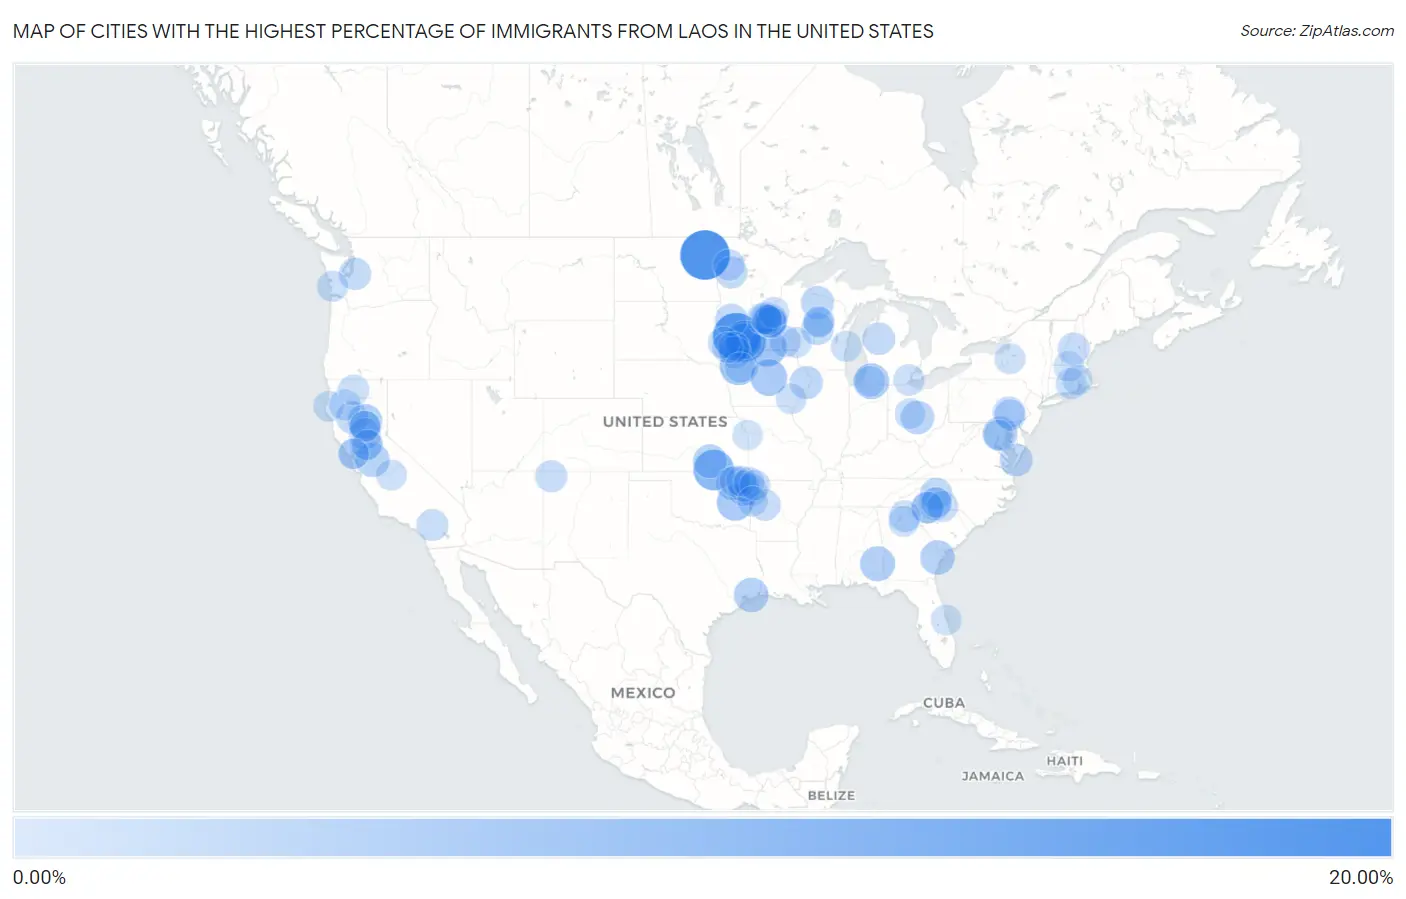
Map of Cities with the Highest Percentage of Immigrants from Laos in the United States
0.00%
20.00%
Cities with the Highest Percentage of Immigrants from Laos in the United States
| City | Laos | vs State | vs National | |
| 1. | Inkster | 19.23% | 0.0068%(+19.2)#-1 | 0.053%(+19.2)#0 |
| 2. | Walnut Grove | 16.49% | 0.43%(+16.1)#-1 | 0.053%(+16.4)#1 |
| 3. | Cincinnati | 14.86% | 0.11%(+14.8)#-1 | 0.053%(+14.8)#2 |
| 4. | Butterfield | 11.57% | 0.43%(+11.1)#0 | 0.053%(+11.5)#3 |
| 5. | Parkerfield | 10.82% | 0.10%(+10.7)#-1 | 0.053%(+10.8)#4 |
| 6. | Camp Croft | 8.80% | 0.023%(+8.78)#-1 | 0.053%(+8.75)#5 |
| 7. | Hayward | 8.33% | 0.43%(+7.90)#1 | 0.053%(+8.28)#6 |
| 8. | Alta | 8.11% | 0.12%(+8.00)#-1 | 0.053%(+8.06)#7 |
| 9. | Clemons | 7.19% | 0.12%(+7.07)#0 | 0.053%(+7.14)#8 |
| 10. | Carlton Landing | 6.98% | 0.071%(+6.91)#-1 | 0.053%(+6.92)#9 |
| 11. | Mountain Lake | 6.74% | 0.43%(+6.31)#2 | 0.053%(+6.68)#10 |
| 12. | Vandalia | 6.43% | 0.030%(+6.40)#-1 | 0.053%(+6.37)#11 |
| 13. | Blue Springs | 5.66% | 0.0090%(+5.65)#-1 | 0.053%(+5.61)#12 |
| 14. | Concow | 5.33% | 0.12%(+5.20)#-1 | 0.053%(+5.28)#13 |
| 15. | Stowell | 5.26% | 0.031%(+5.22)#-1 | 0.053%(+5.20)#14 |
| 16. | Henderson | 5.22% | 0.041%(+5.18)#-1 | 0.053%(+5.17)#15 |
| 17. | Enon Valley Borough | 5.21% | 0.017%(+5.20)#-1 | 0.053%(+5.16)#16 |
| 18. | West Laurel | 5.15% | 0.020%(+5.13)#-1 | 0.053%(+5.09)#17 |
| 19. | Rouse | 4.79% | 0.12%(+4.66)#0 | 0.053%(+4.73)#18 |
| 20. | Oaklawn Sunview | 4.69% | 0.10%(+4.59)#0 | 0.053%(+4.64)#19 |
| 21. | Etna | 4.38% | 0.021%(+4.36)#-1 | 0.053%(+4.33)#20 |
| 22. | Limestone | 4.24% | 0.071%(+4.17)#0 | 0.053%(+4.19)#21 |
| 23. | Brooklyn Park | 4.00% | 0.43%(+3.57)#3 | 0.053%(+3.95)#22 |
| 24. | Dewitt | 3.96% | 0.12%(+3.84)#1 | 0.053%(+3.91)#23 |
| 25. | Minocqua | 3.87% | 0.22%(+3.66)#-1 | 0.053%(+3.82)#24 |
| 26. | Maplewood | 3.84% | 0.43%(+3.41)#15 | 0.053%(+3.79)#1,335 |
| 27. | Bobtown | 3.74% | 0.027%(+3.71)#-1 | 0.053%(+3.69)#1,336 |
| 28. | Grover | 3.68% | 0.048%(+3.63)#-1 | 0.053%(+3.63)#1,337 |
| 29. | Watson | 3.66% | 0.43%(+3.23)#16 | 0.053%(+3.61)#1,338 |
| 30. | Junction City | 3.47% | 0.22%(+3.25)#0 | 0.053%(+3.42)#1,339 |
| 31. | Franklin Cdp Merced County | 3.46% | 0.12%(+3.33)#1 | 0.053%(+3.40)#1,340 |
| 32. | Rancho Tehama Reserve | 3.40% | 0.12%(+3.28)#2 | 0.053%(+3.35)#1,341 |
| 33. | Tustin | 3.40% | 0.030%(+3.37)#0 | 0.053%(+3.35)#1,342 |
| 34. | Ocheyedan | 3.29% | 0.12%(+3.18)#2 | 0.053%(+3.24)#1,343 |
| 35. | Algona | 3.28% | 0.077%(+3.20)#-1 | 0.053%(+3.23)#1,344 |
| 36. | Sand Pillow | 3.27% | 0.22%(+3.05)#1 | 0.053%(+3.21)#1,345 |
| 37. | Long View | 3.24% | 0.048%(+3.19)#0 | 0.053%(+3.19)#1,346 |
| 38. | Midway | 3.12% | 0.43%(+2.69)#17 | 0.053%(+3.07)#1,347 |
| 39. | Steely Hollow | 3.10% | 0.071%(+3.03)#1 | 0.053%(+3.05)#1,348 |
| 40. | Bristol | 3.01% | 0.037%(+2.97)#-1 | 0.053%(+2.95)#1,349 |
| 41. | Cabazon | 2.98% | 0.12%(+2.86)#3 | 0.053%(+2.93)#1,350 |
| 42. | Waterflow | 2.94% | 0.0095%(+2.93)#-1 | 0.053%(+2.89)#1,351 |
| 43. | Lincoln | 2.94% | 0.11%(+2.83)#0 | 0.053%(+2.89)#1,352 |
| 44. | Fairforest | 2.89% | 0.023%(+2.87)#0 | 0.053%(+2.84)#1,353 |
| 45. | Brickerville | 2.84% | 0.017%(+2.83)#0 | 0.053%(+2.79)#1,354 |
| 46. | Linda | 2.82% | 0.12%(+2.70)#4 | 0.053%(+2.77)#1,355 |
| 47. | Ihlen | 2.82% | 0.43%(+2.39)#18 | 0.053%(+2.76)#1,356 |
| 48. | Worthington | 2.75% | 0.43%(+2.32)#19 | 0.053%(+2.70)#1,357 |
| 49. | Arcadia | 2.71% | 0.023%(+2.68)#1 | 0.053%(+2.65)#1,358 |
| 50. | Lemon Hill | 2.68% | 0.12%(+2.56)#5 | 0.053%(+2.63)#1,359 |
| 51. | North St Paul | 2.67% | 0.43%(+2.24)#20 | 0.053%(+2.62)#1,360 |
| 52. | St Paul | 2.63% | 0.43%(+2.20)#21 | 0.053%(+2.58)#1,435 |
| 53. | Belleville | 2.59% | 0.11%(+2.48)#1 | 0.053%(+2.53)#1,436 |
| 54. | South Oroville | 2.58% | 0.12%(+2.45)#6 | 0.053%(+2.52)#1,437 |
| 55. | Corcoran | 2.57% | 0.43%(+2.13)#22 | 0.053%(+2.51)#1,438 |
| 56. | Alto | 2.56% | 0.041%(+2.52)#0 | 0.053%(+2.51)#1,439 |
| 57. | Brownstown | 2.54% | 0.017%(+2.52)#1 | 0.053%(+2.49)#1,440 |
| 58. | St Charles | 2.51% | 0.43%(+2.08)#23 | 0.053%(+2.46)#1,441 |
| 59. | Erskine | 2.50% | 0.43%(+2.07)#24 | 0.053%(+2.45)#1,442 |
| 60. | Woodland Beach | 2.39% | 0.030%(+2.36)#1 | 0.053%(+2.33)#1,443 |
| 61. | Douglas City | 2.36% | 0.12%(+2.23)#7 | 0.053%(+2.30)#1,444 |
| 62. | Newport | 2.26% | 0.43%(+1.83)#25 | 0.053%(+2.21)#1,445 |
| 63. | Riverview | 2.24% | 0.023%(+2.22)#2 | 0.053%(+2.19)#1,446 |
| 64. | Leach | 2.22% | 0.071%(+2.15)#2 | 0.053%(+2.17)#1,447 |
| 65. | Bushyhead | 2.22% | 0.071%(+2.14)#3 | 0.053%(+2.16)#1,448 |
| 66. | South Bend | 2.21% | 0.077%(+2.13)#0 | 0.053%(+2.15)#1,449 |
| 67. | East Brooklyn | 2.10% | 0.051%(+2.05)#-1 | 0.053%(+2.04)#1,450 |
| 68. | Center City | 2.08% | 0.43%(+1.65)#26 | 0.053%(+2.03)#1,451 |
| 69. | Tara Hills | 2.08% | 0.12%(+1.95)#8 | 0.053%(+2.02)#1,452 |
| 70. | Tarpey Village | 2.06% | 0.12%(+1.93)#9 | 0.053%(+2.00)#1,453 |
| 71. | Hutchison | 2.03% | 0.027%(+2.00)#0 | 0.053%(+1.98)#1,454 |
| 72. | Bayview Cdp Humboldt County | 2.02% | 0.12%(+1.90)#10 | 0.053%(+1.97)#1,455 |
| 73. | Magnolia | 2.02% | 0.43%(+1.59)#27 | 0.053%(+1.97)#1,456 |
| 74. | Sheboygan | 2.01% | 0.22%(+1.79)#2 | 0.053%(+1.95)#1,457 |
| 75. | Weed | 2.00% | 0.12%(+1.88)#11 | 0.053%(+1.95)#1,458 |
| 76. | Cassopolis | 2.00% | 0.030%(+1.97)#2 | 0.053%(+1.95)#1,459 |
| 77. | Hydesville | 1.98% | 0.12%(+1.86)#12 | 0.053%(+1.93)#1,460 |
| 78. | Oroville | 1.95% | 0.12%(+1.83)#13 | 0.053%(+1.90)#1,461 |
| 79. | Wausau | 1.94% | 0.22%(+1.73)#3 | 0.053%(+1.89)#1,462 |
| 80. | Florin | 1.93% | 0.12%(+1.80)#14 | 0.053%(+1.88)#1,463 |
| 81. | New California | 1.89% | 0.021%(+1.86)#0 | 0.053%(+1.83)#1,464 |
| 82. | Pendergrass | 1.88% | 0.041%(+1.84)#1 | 0.053%(+1.82)#1,465 |
| 83. | Rothschild | 1.86% | 0.22%(+1.64)#4 | 0.053%(+1.81)#1,466 |
| 84. | Lakeland | 1.83% | 0.011%(+1.82)#-1 | 0.053%(+1.78)#1,467 |
| 85. | Pensacola | 1.82% | 0.071%(+1.75)#4 | 0.053%(+1.77)#1,468 |
| 86. | Maysville | 1.80% | 0.11%(+1.69)#2 | 0.053%(+1.75)#1,469 |
| 87. | Brooklyn Center | 1.80% | 0.43%(+1.37)#28 | 0.053%(+1.74)#1,470 |
| 88. | Storm Lake | 1.79% | 0.12%(+1.67)#3 | 0.053%(+1.73)#1,471 |
| 89. | Mount Pleasant | 1.78% | 0.12%(+1.66)#4 | 0.053%(+1.73)#1,472 |
| 90. | Lowell | 1.78% | 0.11%(+1.67)#3 | 0.053%(+1.73)#1,473 |
| 91. | Onalaska | 1.77% | 0.22%(+1.55)#5 | 0.053%(+1.71)#1,474 |
| 92. | Barling | 1.76% | 0.11%(+1.65)#4 | 0.053%(+1.71)#1,475 |
| 93. | Adelphi | 1.75% | 0.020%(+1.73)#47 | 0.053%(+1.70)#1,476 |
| 94. | Winchendon | 1.75% | 0.035%(+1.71)#-1 | 0.053%(+1.70)#1,477 |
| 95. | Kings Mountain | 1.73% | 0.048%(+1.69)#1 | 0.053%(+1.68)#1,478 |
| 96. | Palm Shores | 1.71% | 0.019%(+1.69)#-1 | 0.053%(+1.66)#1,479 |
| 97. | Woonsocket | 1.66% | 0.19%(+1.47)#4 | 0.053%(+1.61)#1,480 |
| 98. | Mission | 1.61% | 0.10%(+1.50)#1 | 0.053%(+1.55)#1,481 |
| 99. | North Richmond | 1.61% | 0.12%(+1.48)#15 | 0.053%(+1.55)#1,482 |
| 100. | Hilltop | 1.59% | 0.43%(+1.16)#29 | 0.053%(+1.54)#1,483 |
Common Questions
What are the Top 10 Cities with the Highest Percentage of Immigrants from Laos in the United States?
Top 10 Cities with the Highest Percentage of Immigrants from Laos in the United States are:
#1
19.23%
#2
16.49%
#3
11.57%
#4
10.82%
#5
8.33%
#6
8.11%
#7
7.19%
#8
6.98%
#9
6.74%
#10
6.43%
What city has the Highest Percentage of Immigrants from Laos in the United States?
Inkster has the Highest Percentage of Immigrants from Laos in the United States with 19.23%.
What is the Percentage of Immigrants from Laos in the United States?
Percentage of Immigrants from Laos in the United States is 0.053%.