Immigrants from Western Asia vs Swiss Disability Age 35 to 64
COMPARE
Immigrants from Western Asia
Swiss
Disability Age 35 to 64
Disability Age 35 to 64 Comparison
Immigrants from Western Asia
Swiss
10.4%
DISABILITY AGE 35 TO 64
98.0/ 100
METRIC RATING
102nd/ 347
METRIC RANK
11.6%
DISABILITY AGE 35 TO 64
18.7/ 100
METRIC RATING
200th/ 347
METRIC RANK
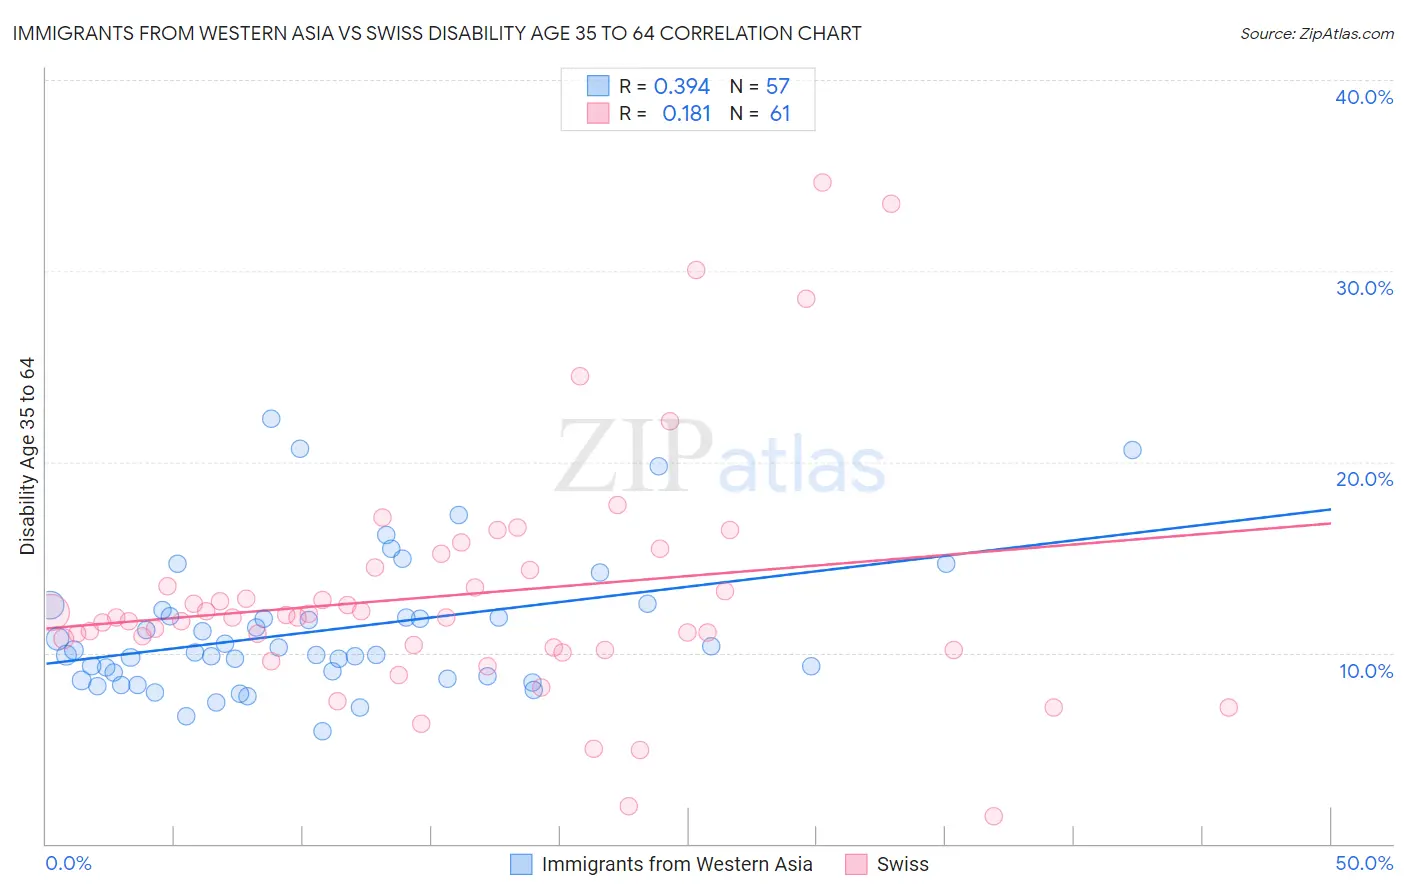
Immigrants from Western Asia vs Swiss Disability Age 35 to 64 Correlation Chart
The statistical analysis conducted on geographies consisting of 404,131,735 people shows a mild positive correlation between the proportion of Immigrants from Western Asia and percentage of population with a disability between the ages 34 and 64 in the United States with a correlation coefficient (R) of 0.394 and weighted average of 10.4%. Similarly, the statistical analysis conducted on geographies consisting of 464,639,334 people shows a poor positive correlation between the proportion of Swiss and percentage of population with a disability between the ages 34 and 64 in the United States with a correlation coefficient (R) of 0.181 and weighted average of 11.6%, a difference of 11.6%.
Disability Age 35 to 64 Correlation Summary
| Measurement | Immigrants from Western Asia | Swiss |
| Minimum | 5.9% | 1.5% |
| Maximum | 22.3% | 34.6% |
| Range | 16.4% | 33.2% |
| Mean | 11.2% | 13.0% |
| Median | 10.0% | 11.8% |
| Interquartile 25% (IQ1) | 8.7% | 10.2% |
| Interquartile 75% (IQ3) | 12.1% | 14.4% |
| Interquartile Range (IQR) | 3.3% | 4.2% |
| Standard Deviation (Sample) | 3.6% | 6.4% |
| Standard Deviation (Population) | 3.6% | 6.3% |
Similar Demographics by Disability Age 35 to 64
Demographics Similar to Immigrants from Western Asia by Disability Age 35 to 64
In terms of disability age 35 to 64, the demographic groups most similar to Immigrants from Western Asia are Immigrants from Ukraine (10.4%, a difference of 0.030%), Immigrants from Philippines (10.4%, a difference of 0.070%), Immigrants from Jordan (10.4%, a difference of 0.11%), Immigrants from Austria (10.4%, a difference of 0.17%), and Macedonian (10.4%, a difference of 0.19%).
| Demographics | Rating | Rank | Disability Age 35 to 64 |
| Chinese | 98.7 /100 | #95 | Exceptional 10.3% |
| Immigrants | South Africa | 98.5 /100 | #96 | Exceptional 10.3% |
| Immigrants | Denmark | 98.4 /100 | #97 | Exceptional 10.3% |
| Immigrants | Uruguay | 98.3 /100 | #98 | Exceptional 10.3% |
| Palestinians | 98.2 /100 | #99 | Exceptional 10.4% |
| Immigrants | Jordan | 98.1 /100 | #100 | Exceptional 10.4% |
| Immigrants | Philippines | 98.0 /100 | #101 | Exceptional 10.4% |
| Immigrants | Western Asia | 98.0 /100 | #102 | Exceptional 10.4% |
| Immigrants | Ukraine | 97.9 /100 | #103 | Exceptional 10.4% |
| Immigrants | Austria | 97.8 /100 | #104 | Exceptional 10.4% |
| Macedonians | 97.8 /100 | #105 | Exceptional 10.4% |
| Immigrants | Hungary | 97.6 /100 | #106 | Exceptional 10.4% |
| Zimbabweans | 97.4 /100 | #107 | Exceptional 10.4% |
| Ethiopians | 97.4 /100 | #108 | Exceptional 10.5% |
| Immigrants | Ethiopia | 97.2 /100 | #109 | Exceptional 10.5% |
Demographics Similar to Swiss by Disability Age 35 to 64
In terms of disability age 35 to 64, the demographic groups most similar to Swiss are Basque (11.6%, a difference of 0.10%), Immigrants from Kenya (11.6%, a difference of 0.13%), Immigrants from Guatemala (11.6%, a difference of 0.15%), Immigrants from Panama (11.6%, a difference of 0.21%), and British (11.6%, a difference of 0.22%).
| Demographics | Rating | Rank | Disability Age 35 to 64 |
| Immigrants | Africa | 29.0 /100 | #193 | Fair 11.5% |
| Immigrants | Latin America | 27.5 /100 | #194 | Fair 11.5% |
| Carpatho Rusyns | 25.3 /100 | #195 | Fair 11.5% |
| Iraqis | 24.2 /100 | #196 | Fair 11.5% |
| Immigrants | Iraq | 21.0 /100 | #197 | Fair 11.6% |
| Immigrants | Panama | 20.4 /100 | #198 | Fair 11.6% |
| Basques | 19.5 /100 | #199 | Poor 11.6% |
| Swiss | 18.7 /100 | #200 | Poor 11.6% |
| Immigrants | Kenya | 17.7 /100 | #201 | Poor 11.6% |
| Immigrants | Guatemala | 17.5 /100 | #202 | Poor 11.6% |
| British | 17.0 /100 | #203 | Poor 11.6% |
| Nigerians | 16.3 /100 | #204 | Poor 11.6% |
| Slavs | 15.5 /100 | #205 | Poor 11.7% |
| Native Hawaiians | 14.8 /100 | #206 | Poor 11.7% |
| Ghanaians | 14.8 /100 | #207 | Poor 11.7% |