Seminole vs Osage Disability Age 35 to 64
COMPARE
Seminole
Osage
Disability Age 35 to 64
Disability Age 35 to 64 Comparison
Seminole
Osage
15.9%
DISABILITY AGE 35 TO 64
0.0/ 100
METRIC RATING
335th/ 347
METRIC RANK
14.5%
DISABILITY AGE 35 TO 64
0.0/ 100
METRIC RATING
316th/ 347
METRIC RANK
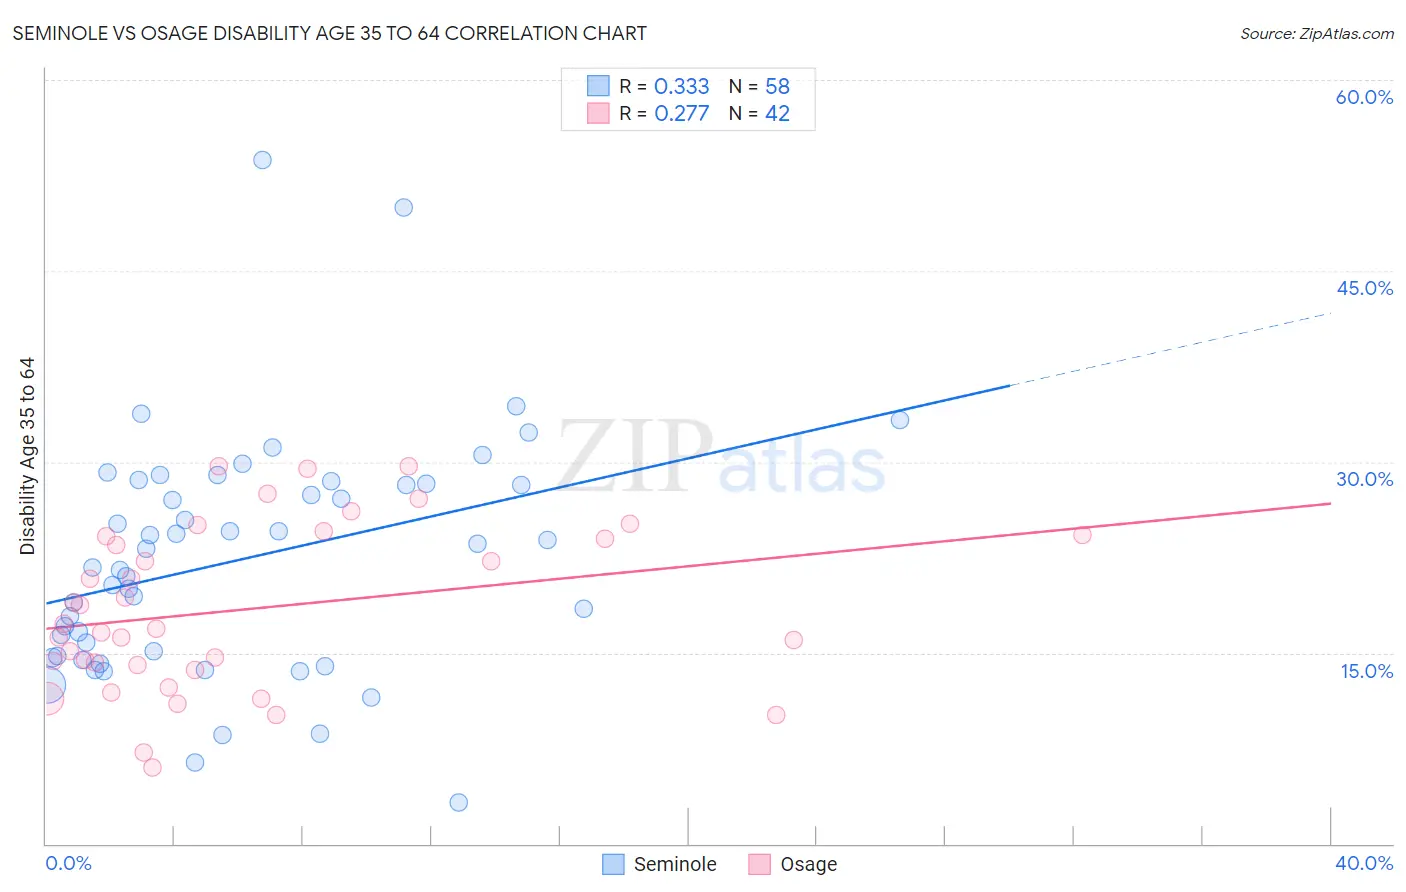
Seminole vs Osage Disability Age 35 to 64 Correlation Chart
The statistical analysis conducted on geographies consisting of 118,297,769 people shows a mild positive correlation between the proportion of Seminole and percentage of population with a disability between the ages 34 and 64 in the United States with a correlation coefficient (R) of 0.333 and weighted average of 15.9%. Similarly, the statistical analysis conducted on geographies consisting of 91,796,232 people shows a weak positive correlation between the proportion of Osage and percentage of population with a disability between the ages 34 and 64 in the United States with a correlation coefficient (R) of 0.277 and weighted average of 14.5%, a difference of 9.4%.
Disability Age 35 to 64 Correlation Summary
| Measurement | Seminole | Osage |
| Minimum | 3.3% | 6.0% |
| Maximum | 53.7% | 29.7% |
| Range | 50.5% | 23.7% |
| Mean | 22.3% | 18.4% |
| Median | 22.5% | 17.1% |
| Interquartile 25% (IQ1) | 14.7% | 14.0% |
| Interquartile 75% (IQ3) | 28.3% | 24.2% |
| Interquartile Range (IQR) | 13.6% | 10.2% |
| Standard Deviation (Sample) | 9.3% | 6.4% |
| Standard Deviation (Population) | 9.2% | 6.3% |
Demographics Similar to Seminole and Osage by Disability Age 35 to 64
In terms of disability age 35 to 64, the demographic groups most similar to Seminole are Colville (15.8%, a difference of 0.10%), Yuman (15.8%, a difference of 0.30%), Alaskan Athabascan (15.7%, a difference of 0.85%), Dutch West Indian (15.6%, a difference of 1.5%), and Navajo (15.5%, a difference of 2.4%). Similarly, the demographic groups most similar to Osage are Alaska Native (14.5%, a difference of 0.19%), Crow (14.6%, a difference of 0.87%), Ottawa (14.6%, a difference of 0.95%), Immigrants from Cabo Verde (14.7%, a difference of 1.4%), and Black/African American (14.7%, a difference of 1.5%).
| Demographics | Rating | Rank | Disability Age 35 to 64 |
| Alaska Natives | 0.0 /100 | #315 | Tragic 14.5% |
| Osage | 0.0 /100 | #316 | Tragic 14.5% |
| Crow | 0.0 /100 | #317 | Tragic 14.6% |
| Ottawa | 0.0 /100 | #318 | Tragic 14.6% |
| Immigrants | Cabo Verde | 0.0 /100 | #319 | Tragic 14.7% |
| Blacks/African Americans | 0.0 /100 | #320 | Tragic 14.7% |
| Comanche | 0.0 /100 | #321 | Tragic 14.7% |
| Potawatomi | 0.0 /100 | #322 | Tragic 14.8% |
| Apache | 0.0 /100 | #323 | Tragic 14.9% |
| Chippewa | 0.0 /100 | #324 | Tragic 15.0% |
| Arapaho | 0.0 /100 | #325 | Tragic 15.1% |
| Natives/Alaskans | 0.0 /100 | #326 | Tragic 15.3% |
| Pueblo | 0.0 /100 | #327 | Tragic 15.3% |
| Cajuns | 0.0 /100 | #328 | Tragic 15.3% |
| Cherokee | 0.0 /100 | #329 | Tragic 15.5% |
| Navajo | 0.0 /100 | #330 | Tragic 15.5% |
| Dutch West Indians | 0.0 /100 | #331 | Tragic 15.6% |
| Alaskan Athabascans | 0.0 /100 | #332 | Tragic 15.7% |
| Yuman | 0.0 /100 | #333 | Tragic 15.8% |
| Colville | 0.0 /100 | #334 | Tragic 15.8% |
| Seminole | 0.0 /100 | #335 | Tragic 15.9% |