Arapaho vs Immigrants from Albania Bachelor's Degree
COMPARE
Arapaho
Immigrants from Albania
Bachelor's Degree
Bachelor's Degree Comparison
Arapaho
Immigrants from Albania
26.6%
BACHELOR'S DEGREE
0.0/ 100
METRIC RATING
334th/ 347
METRIC RANK
40.4%
BACHELOR'S DEGREE
94.4/ 100
METRIC RATING
122nd/ 347
METRIC RANK
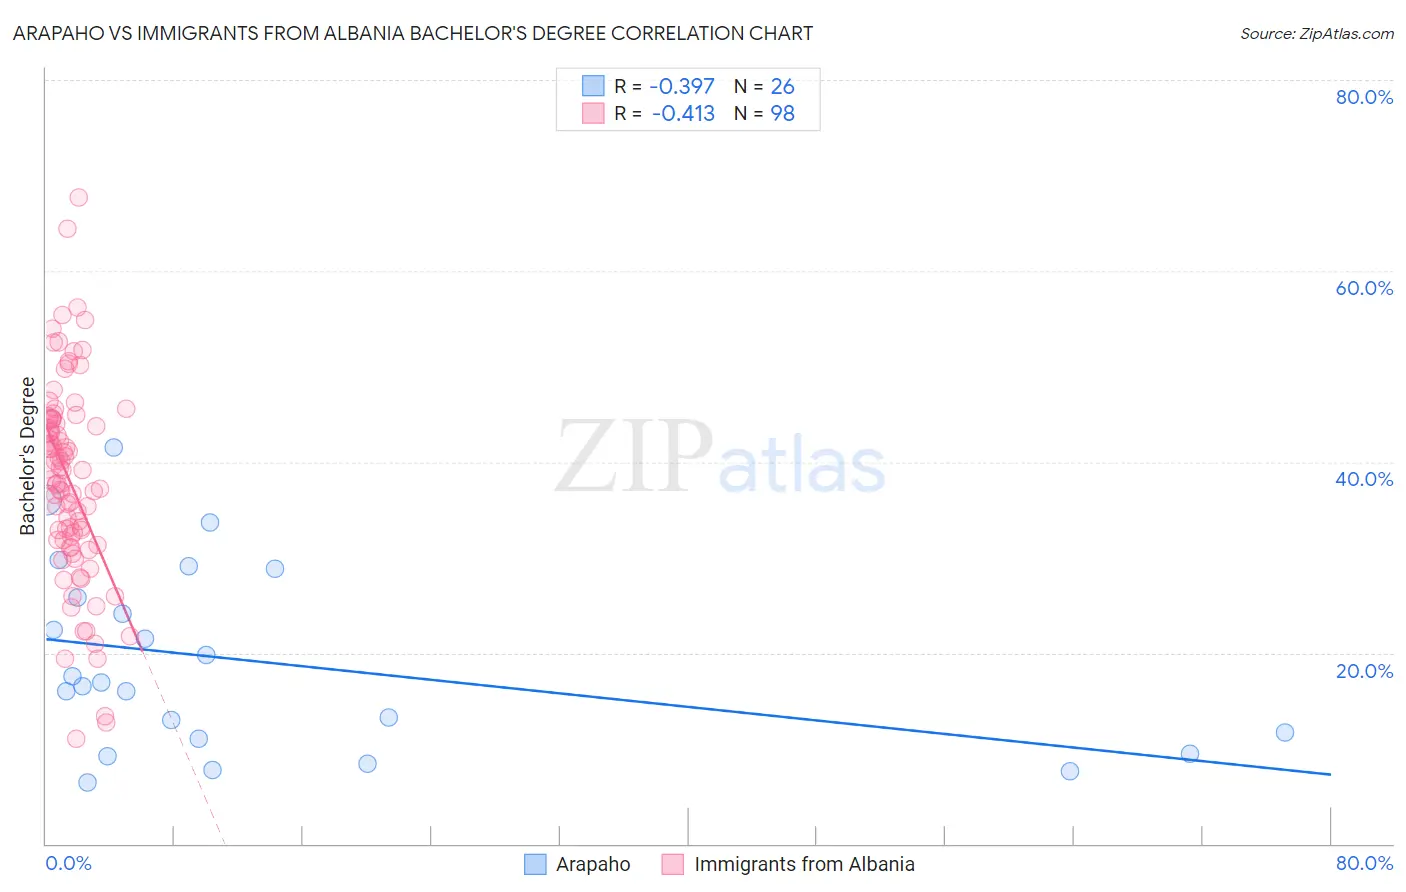
Arapaho vs Immigrants from Albania Bachelor's Degree Correlation Chart
The statistical analysis conducted on geographies consisting of 29,779,045 people shows a mild negative correlation between the proportion of Arapaho and percentage of population with at least bachelor's degree education in the United States with a correlation coefficient (R) of -0.397 and weighted average of 26.6%. Similarly, the statistical analysis conducted on geographies consisting of 119,391,185 people shows a moderate negative correlation between the proportion of Immigrants from Albania and percentage of population with at least bachelor's degree education in the United States with a correlation coefficient (R) of -0.413 and weighted average of 40.4%, a difference of 51.8%.
Bachelor's Degree Correlation Summary
| Measurement | Arapaho | Immigrants from Albania |
| Minimum | 6.4% | 11.0% |
| Maximum | 41.6% | 67.7% |
| Range | 35.1% | 56.7% |
| Mean | 18.9% | 37.9% |
| Median | 16.7% | 37.9% |
| Interquartile 25% (IQ1) | 11.0% | 31.8% |
| Interquartile 75% (IQ3) | 25.8% | 44.5% |
| Interquartile Range (IQR) | 14.8% | 12.7% |
| Standard Deviation (Sample) | 9.7% | 10.4% |
| Standard Deviation (Population) | 9.5% | 10.4% |
Similar Demographics by Bachelor's Degree
Demographics Similar to Arapaho by Bachelor's Degree
In terms of bachelor's degree, the demographic groups most similar to Arapaho are Native/Alaskan (26.3%, a difference of 1.1%), Mexican (27.1%, a difference of 1.7%), Immigrants from Mexico (26.1%, a difference of 1.9%), Menominee (27.3%, a difference of 2.5%), and Immigrants from the Azores (27.3%, a difference of 2.6%).
| Demographics | Rating | Rank | Bachelor's Degree |
| Paiute | 0.0 /100 | #327 | Tragic 28.1% |
| Crow | 0.0 /100 | #328 | Tragic 27.7% |
| Immigrants | Central America | 0.0 /100 | #329 | Tragic 27.5% |
| Spanish American Indians | 0.0 /100 | #330 | Tragic 27.5% |
| Immigrants | Azores | 0.0 /100 | #331 | Tragic 27.3% |
| Menominee | 0.0 /100 | #332 | Tragic 27.3% |
| Mexicans | 0.0 /100 | #333 | Tragic 27.1% |
| Arapaho | 0.0 /100 | #334 | Tragic 26.6% |
| Natives/Alaskans | 0.0 /100 | #335 | Tragic 26.3% |
| Immigrants | Mexico | 0.0 /100 | #336 | Tragic 26.1% |
| Inupiat | 0.0 /100 | #337 | Tragic 25.8% |
| Pueblo | 0.0 /100 | #338 | Tragic 25.5% |
| Hopi | 0.0 /100 | #339 | Tragic 25.3% |
| Lumbee | 0.0 /100 | #340 | Tragic 24.8% |
| Yuman | 0.0 /100 | #341 | Tragic 24.5% |
Demographics Similar to Immigrants from Albania by Bachelor's Degree
In terms of bachelor's degree, the demographic groups most similar to Immigrants from Albania are Lebanese (40.4%, a difference of 0.020%), Immigrants from Eritrea (40.4%, a difference of 0.020%), British (40.4%, a difference of 0.060%), Moroccan (40.5%, a difference of 0.10%), and Immigrants from Eastern Africa (40.4%, a difference of 0.10%).
| Demographics | Rating | Rank | Bachelor's Degree |
| Palestinians | 95.8 /100 | #115 | Exceptional 40.7% |
| Immigrants | Uganda | 95.7 /100 | #116 | Exceptional 40.7% |
| Austrians | 95.5 /100 | #117 | Exceptional 40.6% |
| Croatians | 95.5 /100 | #118 | Exceptional 40.6% |
| Immigrants | Syria | 94.9 /100 | #119 | Exceptional 40.5% |
| Venezuelans | 94.7 /100 | #120 | Exceptional 40.5% |
| Moroccans | 94.6 /100 | #121 | Exceptional 40.5% |
| Immigrants | Albania | 94.4 /100 | #122 | Exceptional 40.4% |
| Lebanese | 94.3 /100 | #123 | Exceptional 40.4% |
| Immigrants | Eritrea | 94.3 /100 | #124 | Exceptional 40.4% |
| British | 94.2 /100 | #125 | Exceptional 40.4% |
| Immigrants | Eastern Africa | 94.1 /100 | #126 | Exceptional 40.4% |
| Immigrants | Jordan | 93.4 /100 | #127 | Exceptional 40.3% |
| Immigrants | Venezuela | 92.9 /100 | #128 | Exceptional 40.2% |
| Serbians | 92.4 /100 | #129 | Exceptional 40.1% |