Arapaho vs Immigrants from Sweden Bachelor's Degree
COMPARE
Arapaho
Immigrants from Sweden
Bachelor's Degree
Bachelor's Degree Comparison
Arapaho
Immigrants from Sweden
26.6%
BACHELOR'S DEGREE
0.0/ 100
METRIC RATING
334th/ 347
METRIC RANK
47.0%
BACHELOR'S DEGREE
100.0/ 100
METRIC RATING
23rd/ 347
METRIC RANK
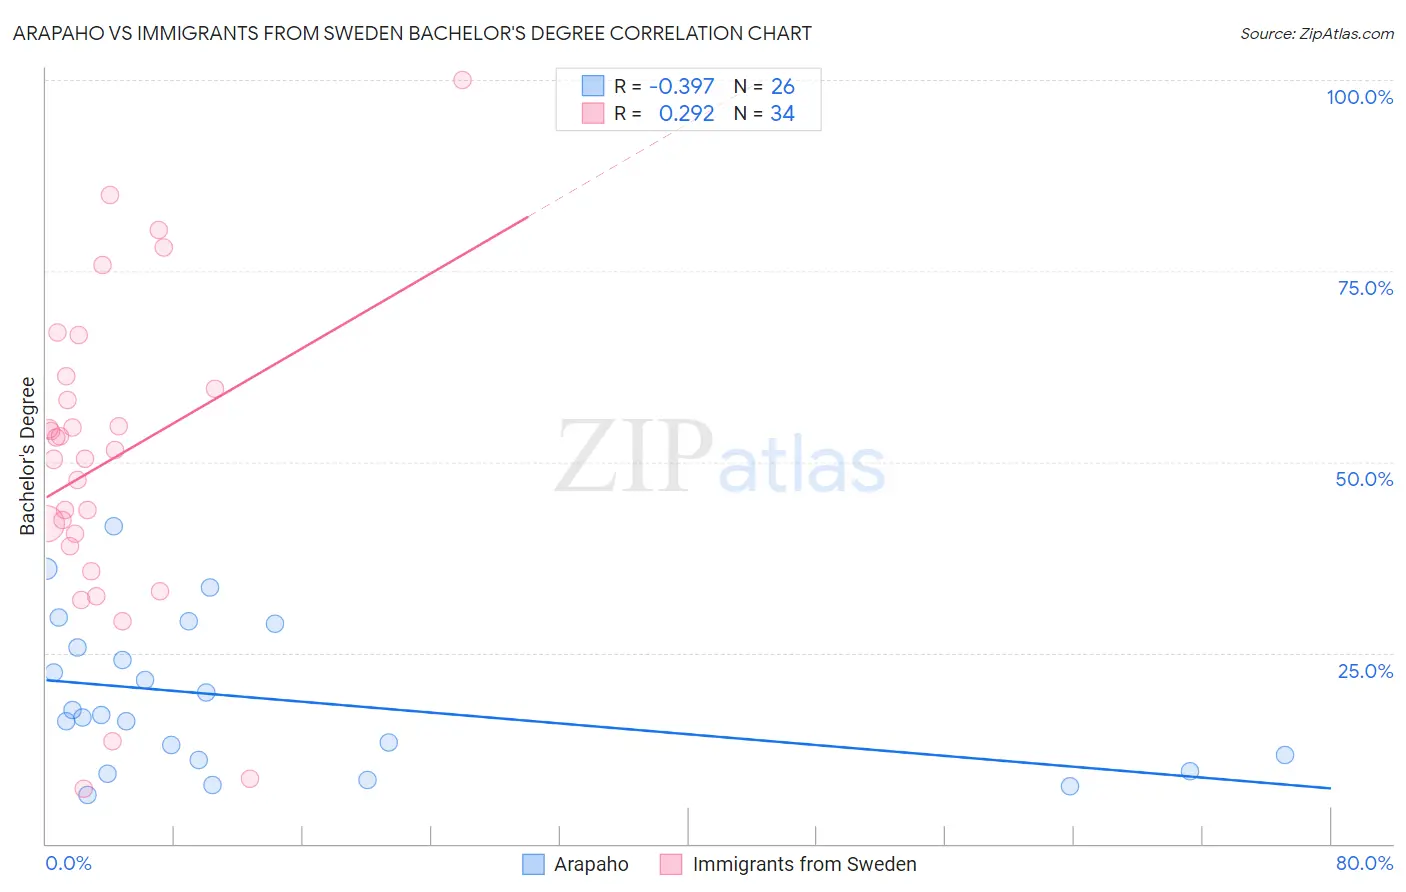
Arapaho vs Immigrants from Sweden Bachelor's Degree Correlation Chart
The statistical analysis conducted on geographies consisting of 29,779,045 people shows a mild negative correlation between the proportion of Arapaho and percentage of population with at least bachelor's degree education in the United States with a correlation coefficient (R) of -0.397 and weighted average of 26.6%. Similarly, the statistical analysis conducted on geographies consisting of 164,727,727 people shows a weak positive correlation between the proportion of Immigrants from Sweden and percentage of population with at least bachelor's degree education in the United States with a correlation coefficient (R) of 0.292 and weighted average of 47.0%, a difference of 76.5%.
Bachelor's Degree Correlation Summary
| Measurement | Arapaho | Immigrants from Sweden |
| Minimum | 6.4% | 7.1% |
| Maximum | 41.6% | 100.0% |
| Range | 35.1% | 92.9% |
| Mean | 18.9% | 49.9% |
| Median | 16.7% | 51.0% |
| Interquartile 25% (IQ1) | 11.0% | 39.0% |
| Interquartile 75% (IQ3) | 25.8% | 59.6% |
| Interquartile Range (IQR) | 14.8% | 20.6% |
| Standard Deviation (Sample) | 9.7% | 20.5% |
| Standard Deviation (Population) | 9.5% | 20.2% |
Similar Demographics by Bachelor's Degree
Demographics Similar to Arapaho by Bachelor's Degree
In terms of bachelor's degree, the demographic groups most similar to Arapaho are Native/Alaskan (26.3%, a difference of 1.1%), Mexican (27.1%, a difference of 1.7%), Immigrants from Mexico (26.1%, a difference of 1.9%), Menominee (27.3%, a difference of 2.5%), and Immigrants from the Azores (27.3%, a difference of 2.6%).
| Demographics | Rating | Rank | Bachelor's Degree |
| Paiute | 0.0 /100 | #327 | Tragic 28.1% |
| Crow | 0.0 /100 | #328 | Tragic 27.7% |
| Immigrants | Central America | 0.0 /100 | #329 | Tragic 27.5% |
| Spanish American Indians | 0.0 /100 | #330 | Tragic 27.5% |
| Immigrants | Azores | 0.0 /100 | #331 | Tragic 27.3% |
| Menominee | 0.0 /100 | #332 | Tragic 27.3% |
| Mexicans | 0.0 /100 | #333 | Tragic 27.1% |
| Arapaho | 0.0 /100 | #334 | Tragic 26.6% |
| Natives/Alaskans | 0.0 /100 | #335 | Tragic 26.3% |
| Immigrants | Mexico | 0.0 /100 | #336 | Tragic 26.1% |
| Inupiat | 0.0 /100 | #337 | Tragic 25.8% |
| Pueblo | 0.0 /100 | #338 | Tragic 25.5% |
| Hopi | 0.0 /100 | #339 | Tragic 25.3% |
| Lumbee | 0.0 /100 | #340 | Tragic 24.8% |
| Yuman | 0.0 /100 | #341 | Tragic 24.5% |
Demographics Similar to Immigrants from Sweden by Bachelor's Degree
In terms of bachelor's degree, the demographic groups most similar to Immigrants from Sweden are Immigrants from Korea (47.0%, a difference of 0.040%), Immigrants from Belgium (47.0%, a difference of 0.090%), Burmese (46.9%, a difference of 0.26%), Immigrants from Ireland (47.1%, a difference of 0.29%), and Immigrants from Switzerland (47.1%, a difference of 0.30%).
| Demographics | Rating | Rank | Bachelor's Degree |
| Soviet Union | 100.0 /100 | #16 | Exceptional 47.9% |
| Eastern Europeans | 100.0 /100 | #17 | Exceptional 47.5% |
| Indians (Asian) | 100.0 /100 | #18 | Exceptional 47.4% |
| Cambodians | 100.0 /100 | #19 | Exceptional 47.2% |
| Immigrants | Switzerland | 100.0 /100 | #20 | Exceptional 47.1% |
| Immigrants | Ireland | 100.0 /100 | #21 | Exceptional 47.1% |
| Immigrants | Belgium | 100.0 /100 | #22 | Exceptional 47.0% |
| Immigrants | Sweden | 100.0 /100 | #23 | Exceptional 47.0% |
| Immigrants | Korea | 100.0 /100 | #24 | Exceptional 47.0% |
| Burmese | 100.0 /100 | #25 | Exceptional 46.9% |
| Immigrants | Japan | 100.0 /100 | #26 | Exceptional 46.8% |
| Immigrants | France | 100.0 /100 | #27 | Exceptional 46.4% |
| Turks | 100.0 /100 | #28 | Exceptional 46.2% |
| Israelis | 100.0 /100 | #29 | Exceptional 46.1% |
| Immigrants | Sri Lanka | 100.0 /100 | #30 | Exceptional 46.1% |