Bhutanese vs Bahamian 1st Grade
COMPARE
Bhutanese
Bahamian
1st Grade
1st Grade Comparison
Bhutanese
Bahamians
98.2%
1ST GRADE
97.3/ 100
METRIC RATING
108th/ 347
METRIC RANK
97.7%
1ST GRADE
7.5/ 100
METRIC RATING
215th/ 347
METRIC RANK
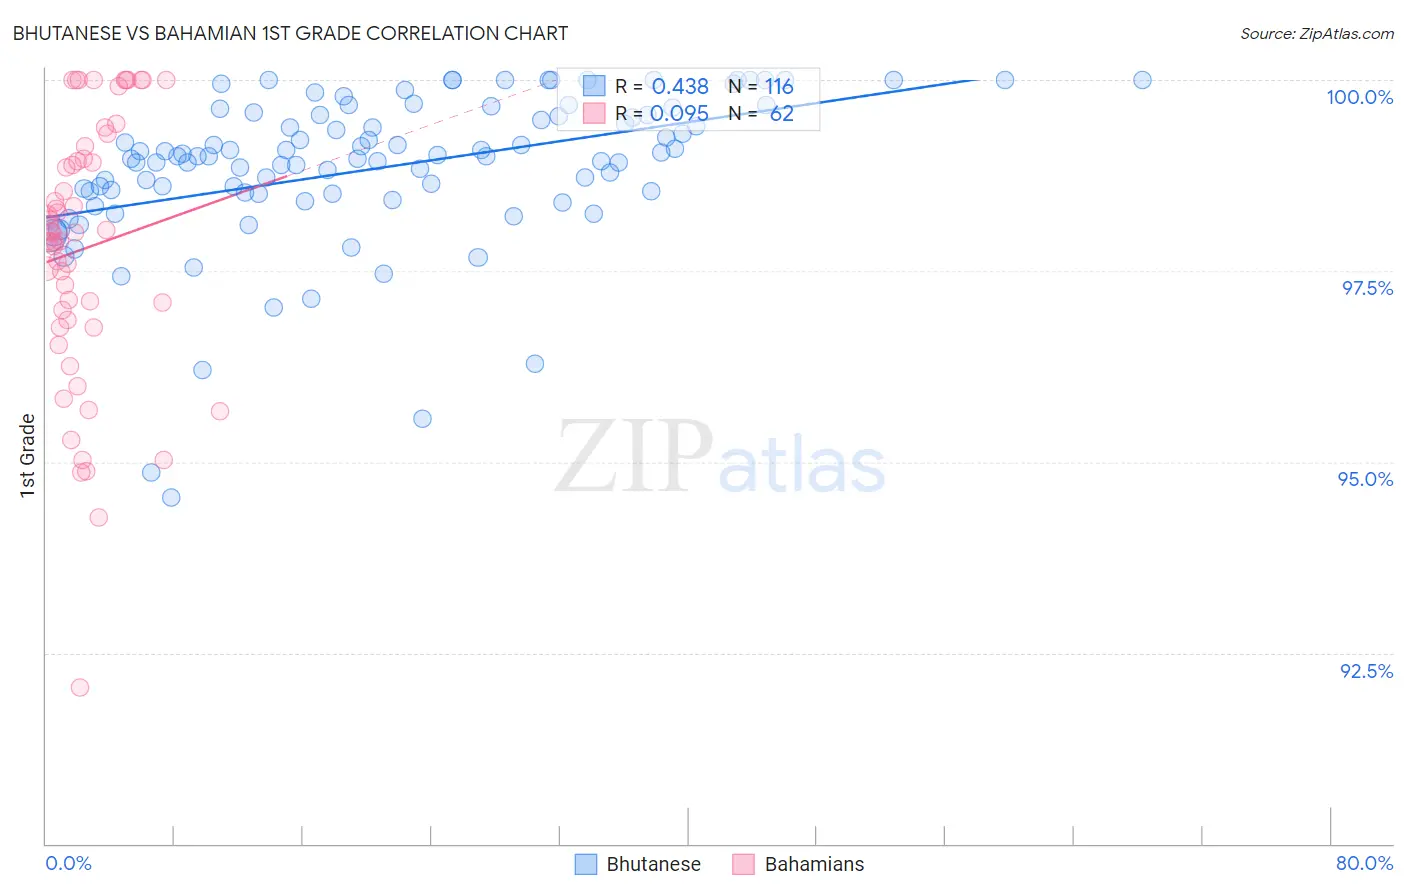
Bhutanese vs Bahamian 1st Grade Correlation Chart
The statistical analysis conducted on geographies consisting of 455,591,119 people shows a moderate positive correlation between the proportion of Bhutanese and percentage of population with at least 1st grade education in the United States with a correlation coefficient (R) of 0.438 and weighted average of 98.2%. Similarly, the statistical analysis conducted on geographies consisting of 112,673,855 people shows a slight positive correlation between the proportion of Bahamians and percentage of population with at least 1st grade education in the United States with a correlation coefficient (R) of 0.095 and weighted average of 97.7%, a difference of 0.47%.
1st Grade Correlation Summary
| Measurement | Bhutanese | Bahamian |
| Minimum | 94.5% | 92.1% |
| Maximum | 100.0% | 100.0% |
| Range | 5.5% | 7.9% |
| Mean | 98.9% | 97.8% |
| Median | 99.0% | 98.0% |
| Interquartile 25% (IQ1) | 98.5% | 96.9% |
| Interquartile 75% (IQ3) | 99.5% | 99.0% |
| Interquartile Range (IQR) | 1.0% | 2.1% |
| Standard Deviation (Sample) | 1.0% | 1.7% |
| Standard Deviation (Population) | 1.0% | 1.7% |
Similar Demographics by 1st Grade
Demographics Similar to Bhutanese by 1st Grade
In terms of 1st grade, the demographic groups most similar to Bhutanese are Basque (98.2%, a difference of 0.0%), Turkish (98.2%, a difference of 0.0%), Immigrants from Switzerland (98.2%, a difference of 0.0%), German Russian (98.2%, a difference of 0.0%), and Pima (98.2%, a difference of 0.010%).
| Demographics | Rating | Rank | 1st Grade |
| Romanians | 97.8 /100 | #101 | Exceptional 98.2% |
| Cree | 97.8 /100 | #102 | Exceptional 98.2% |
| Immigrants | Ireland | 97.7 /100 | #103 | Exceptional 98.2% |
| Pima | 97.5 /100 | #104 | Exceptional 98.2% |
| Basques | 97.4 /100 | #105 | Exceptional 98.2% |
| Turks | 97.4 /100 | #106 | Exceptional 98.2% |
| Immigrants | Switzerland | 97.3 /100 | #107 | Exceptional 98.2% |
| Bhutanese | 97.3 /100 | #108 | Exceptional 98.2% |
| German Russians | 97.1 /100 | #109 | Exceptional 98.2% |
| Immigrants | Singapore | 96.7 /100 | #110 | Exceptional 98.2% |
| Immigrants | Czechoslovakia | 96.6 /100 | #111 | Exceptional 98.2% |
| Immigrants | Norway | 96.6 /100 | #112 | Exceptional 98.2% |
| Immigrants | Latvia | 96.4 /100 | #113 | Exceptional 98.2% |
| Ute | 96.2 /100 | #114 | Exceptional 98.2% |
| Iranians | 96.0 /100 | #115 | Exceptional 98.2% |
Demographics Similar to Bahamians by 1st Grade
In terms of 1st grade, the demographic groups most similar to Bahamians are South American Indian (97.7%, a difference of 0.0%), Uruguayan (97.7%, a difference of 0.0%), Moroccan (97.7%, a difference of 0.010%), Immigrants from Bahamas (97.7%, a difference of 0.010%), and Samoan (97.7%, a difference of 0.010%).
| Demographics | Rating | Rank | 1st Grade |
| Immigrants | Northern Africa | 12.0 /100 | #208 | Poor 97.8% |
| Costa Ricans | 11.6 /100 | #209 | Poor 97.8% |
| Immigrants | Oceania | 11.0 /100 | #210 | Poor 97.8% |
| Laotians | 10.3 /100 | #211 | Poor 97.8% |
| Moroccans | 8.7 /100 | #212 | Tragic 97.7% |
| Immigrants | Bahamas | 8.1 /100 | #213 | Tragic 97.7% |
| South American Indians | 7.6 /100 | #214 | Tragic 97.7% |
| Bahamians | 7.5 /100 | #215 | Tragic 97.7% |
| Uruguayans | 7.4 /100 | #216 | Tragic 97.7% |
| Samoans | 6.8 /100 | #217 | Tragic 97.7% |
| Immigrants | Morocco | 5.3 /100 | #218 | Tragic 97.7% |
| Immigrants | Panama | 5.2 /100 | #219 | Tragic 97.7% |
| Tongans | 4.6 /100 | #220 | Tragic 97.7% |
| Immigrants | Sudan | 4.3 /100 | #221 | Tragic 97.7% |
| Immigrants | Syria | 4.2 /100 | #222 | Tragic 97.7% |