Bhutanese vs Jamaican 1st Grade
COMPARE
Bhutanese
Jamaican
1st Grade
1st Grade Comparison
Bhutanese
Jamaicans
98.2%
1ST GRADE
97.3/ 100
METRIC RATING
108th/ 347
METRIC RANK
97.5%
1ST GRADE
0.6/ 100
METRIC RATING
256th/ 347
METRIC RANK
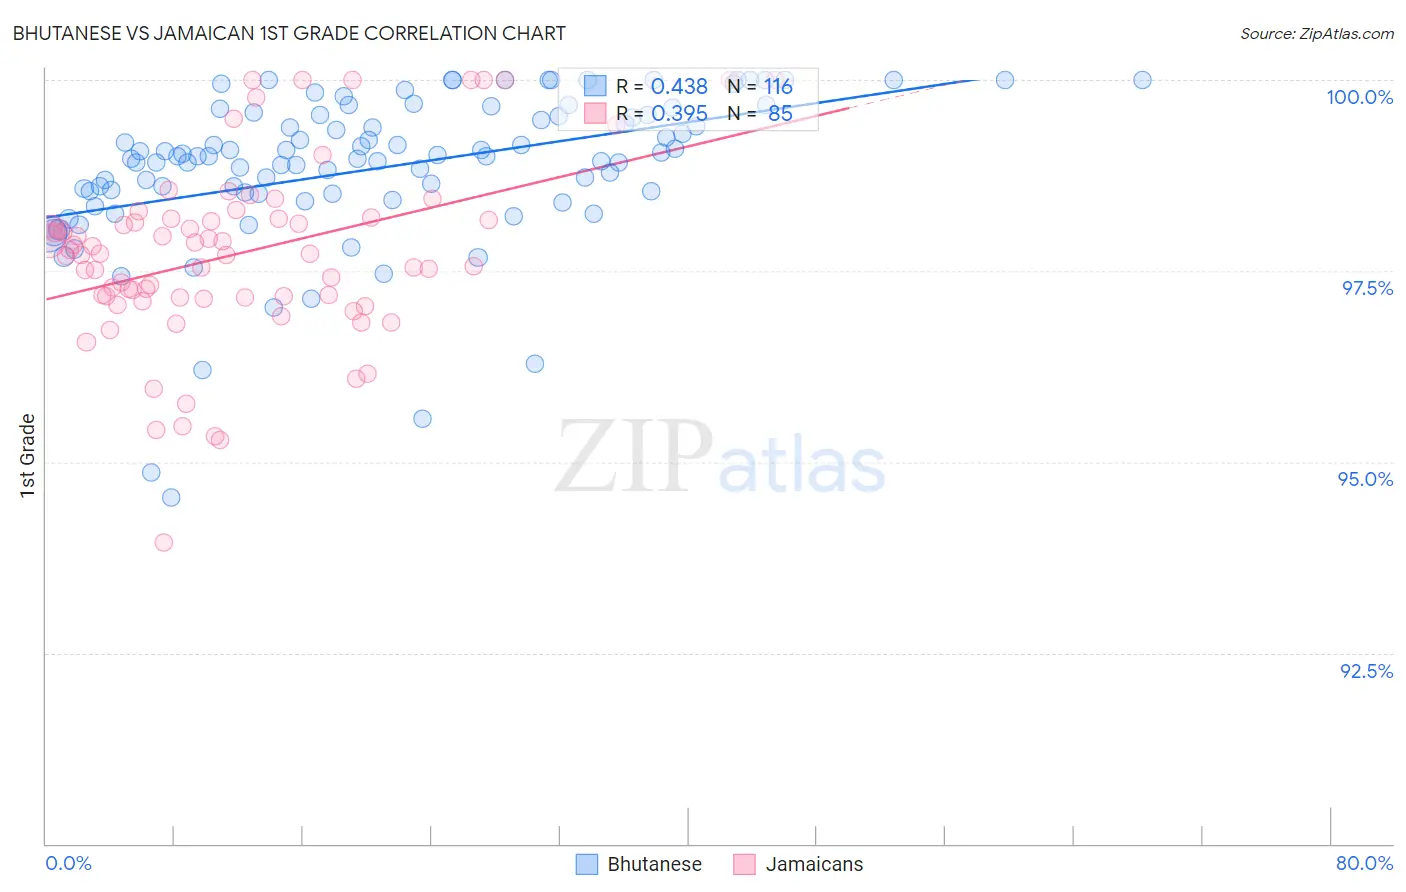
Bhutanese vs Jamaican 1st Grade Correlation Chart
The statistical analysis conducted on geographies consisting of 455,591,119 people shows a moderate positive correlation between the proportion of Bhutanese and percentage of population with at least 1st grade education in the United States with a correlation coefficient (R) of 0.438 and weighted average of 98.2%. Similarly, the statistical analysis conducted on geographies consisting of 368,084,732 people shows a mild positive correlation between the proportion of Jamaicans and percentage of population with at least 1st grade education in the United States with a correlation coefficient (R) of 0.395 and weighted average of 97.5%, a difference of 0.68%.
1st Grade Correlation Summary
| Measurement | Bhutanese | Jamaican |
| Minimum | 94.5% | 93.9% |
| Maximum | 100.0% | 100.0% |
| Range | 5.5% | 6.1% |
| Mean | 98.9% | 97.7% |
| Median | 99.0% | 97.7% |
| Interquartile 25% (IQ1) | 98.5% | 97.2% |
| Interquartile 75% (IQ3) | 99.5% | 98.2% |
| Interquartile Range (IQR) | 1.0% | 1.0% |
| Standard Deviation (Sample) | 1.0% | 1.2% |
| Standard Deviation (Population) | 1.0% | 1.2% |
Similar Demographics by 1st Grade
Demographics Similar to Bhutanese by 1st Grade
In terms of 1st grade, the demographic groups most similar to Bhutanese are Basque (98.2%, a difference of 0.0%), Turkish (98.2%, a difference of 0.0%), Immigrants from Switzerland (98.2%, a difference of 0.0%), German Russian (98.2%, a difference of 0.0%), and Pima (98.2%, a difference of 0.010%).
| Demographics | Rating | Rank | 1st Grade |
| Romanians | 97.8 /100 | #101 | Exceptional 98.2% |
| Cree | 97.8 /100 | #102 | Exceptional 98.2% |
| Immigrants | Ireland | 97.7 /100 | #103 | Exceptional 98.2% |
| Pima | 97.5 /100 | #104 | Exceptional 98.2% |
| Basques | 97.4 /100 | #105 | Exceptional 98.2% |
| Turks | 97.4 /100 | #106 | Exceptional 98.2% |
| Immigrants | Switzerland | 97.3 /100 | #107 | Exceptional 98.2% |
| Bhutanese | 97.3 /100 | #108 | Exceptional 98.2% |
| German Russians | 97.1 /100 | #109 | Exceptional 98.2% |
| Immigrants | Singapore | 96.7 /100 | #110 | Exceptional 98.2% |
| Immigrants | Czechoslovakia | 96.6 /100 | #111 | Exceptional 98.2% |
| Immigrants | Norway | 96.6 /100 | #112 | Exceptional 98.2% |
| Immigrants | Latvia | 96.4 /100 | #113 | Exceptional 98.2% |
| Ute | 96.2 /100 | #114 | Exceptional 98.2% |
| Iranians | 96.0 /100 | #115 | Exceptional 98.2% |
Demographics Similar to Jamaicans by 1st Grade
In terms of 1st grade, the demographic groups most similar to Jamaicans are Immigrants from Colombia (97.5%, a difference of 0.0%), Yaqui (97.5%, a difference of 0.0%), Indian (Asian) (97.5%, a difference of 0.0%), Immigrants from Congo (97.5%, a difference of 0.010%), and Immigrants from Asia (97.5%, a difference of 0.010%).
| Demographics | Rating | Rank | 1st Grade |
| Immigrants | Senegal | 1.0 /100 | #249 | Tragic 97.6% |
| Ethiopians | 0.9 /100 | #250 | Tragic 97.6% |
| Immigrants | Iraq | 0.9 /100 | #251 | Tragic 97.6% |
| Immigrants | Africa | 0.9 /100 | #252 | Tragic 97.6% |
| Immigrants | Congo | 0.7 /100 | #253 | Tragic 97.5% |
| Immigrants | Asia | 0.7 /100 | #254 | Tragic 97.5% |
| Immigrants | Colombia | 0.6 /100 | #255 | Tragic 97.5% |
| Jamaicans | 0.6 /100 | #256 | Tragic 97.5% |
| Yaqui | 0.6 /100 | #257 | Tragic 97.5% |
| Indians (Asian) | 0.6 /100 | #258 | Tragic 97.5% |
| Fijians | 0.5 /100 | #259 | Tragic 97.5% |
| Armenians | 0.5 /100 | #260 | Tragic 97.5% |
| Immigrants | Ethiopia | 0.4 /100 | #261 | Tragic 97.5% |
| Assyrians/Chaldeans/Syriacs | 0.4 /100 | #262 | Tragic 97.5% |
| Immigrants | South America | 0.4 /100 | #263 | Tragic 97.5% |