Filipino vs Lithuanian Professional Degree
COMPARE
Filipino
Lithuanian
Professional Degree
Professional Degree Comparison
Filipinos
Lithuanians
7.6%
PROFESSIONAL DEGREE
100.0/ 100
METRIC RATING
4th/ 347
METRIC RANK
5.4%
PROFESSIONAL DEGREE
99.8/ 100
METRIC RATING
72nd/ 347
METRIC RANK
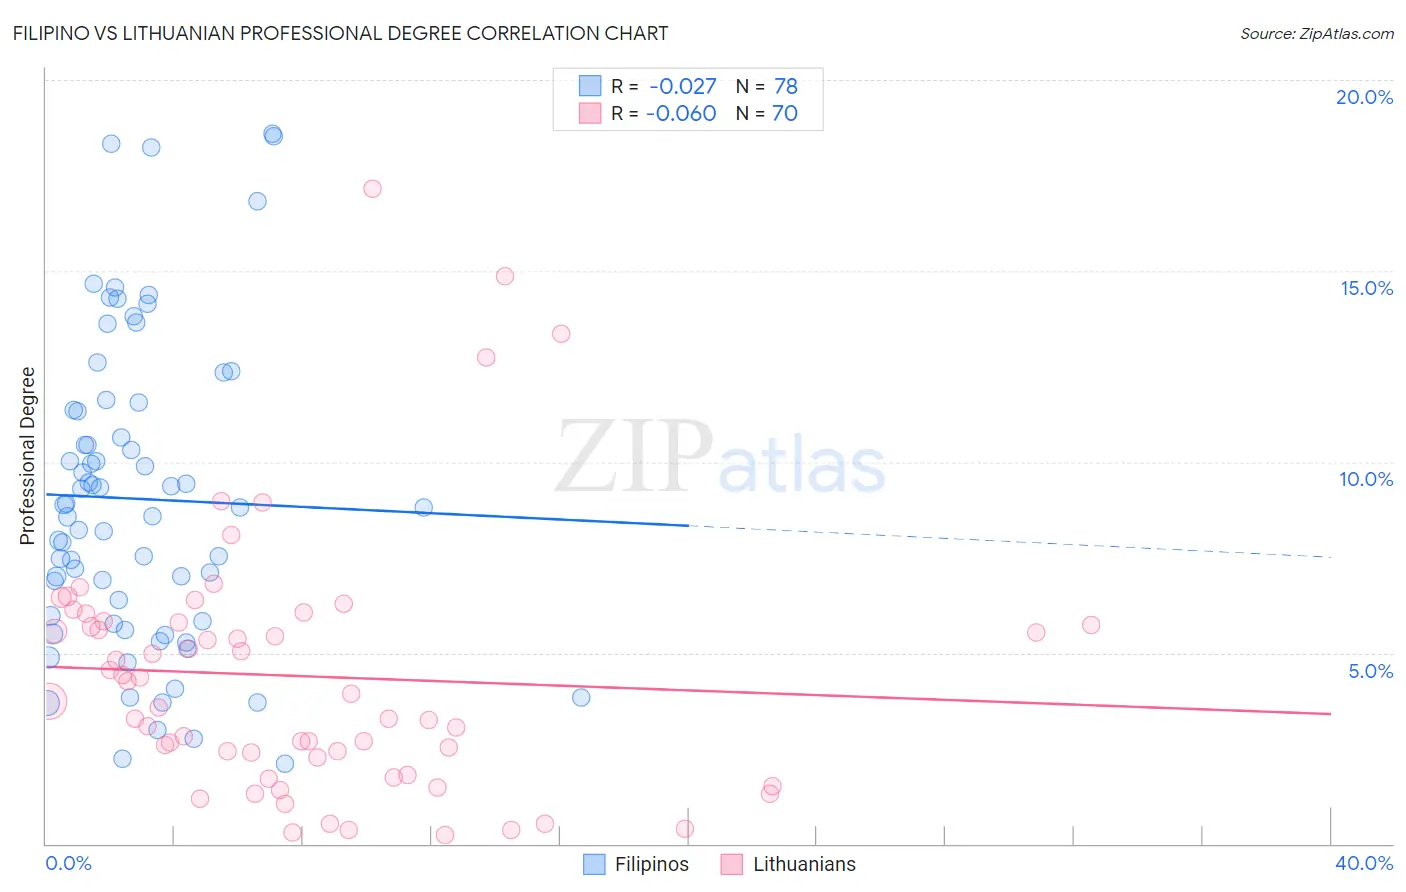
Filipino vs Lithuanian Professional Degree Correlation Chart
The statistical analysis conducted on geographies consisting of 254,169,357 people shows no correlation between the proportion of Filipinos and percentage of population with at least professional degree education in the United States with a correlation coefficient (R) of -0.027 and weighted average of 7.6%. Similarly, the statistical analysis conducted on geographies consisting of 420,702,228 people shows a slight negative correlation between the proportion of Lithuanians and percentage of population with at least professional degree education in the United States with a correlation coefficient (R) of -0.060 and weighted average of 5.4%, a difference of 40.5%.
Professional Degree Correlation Summary
| Measurement | Filipino | Lithuanian |
| Minimum | 2.1% | 0.24% |
| Maximum | 18.6% | 17.2% |
| Range | 16.5% | 16.9% |
| Mean | 9.0% | 4.4% |
| Median | 8.8% | 3.8% |
| Interquartile 25% (IQ1) | 5.8% | 2.3% |
| Interquartile 75% (IQ3) | 11.4% | 5.8% |
| Interquartile Range (IQR) | 5.5% | 3.5% |
| Standard Deviation (Sample) | 4.0% | 3.4% |
| Standard Deviation (Population) | 4.0% | 3.3% |
Similar Demographics by Professional Degree
Demographics Similar to Filipinos by Professional Degree
In terms of professional degree, the demographic groups most similar to Filipinos are Iranian (7.6%, a difference of 0.77%), Immigrants from Singapore (7.7%, a difference of 2.4%), Immigrants from Iran (7.3%, a difference of 3.2%), Okinawan (7.3%, a difference of 3.4%), and Immigrants from Israel (7.9%, a difference of 3.9%).
| Demographics | Rating | Rank | Professional Degree |
| Immigrants | Israel | 100.0 /100 | #1 | Exceptional 7.9% |
| Immigrants | Singapore | 100.0 /100 | #2 | Exceptional 7.7% |
| Iranians | 100.0 /100 | #3 | Exceptional 7.6% |
| Filipinos | 100.0 /100 | #4 | Exceptional 7.6% |
| Immigrants | Iran | 100.0 /100 | #5 | Exceptional 7.3% |
| Okinawans | 100.0 /100 | #6 | Exceptional 7.3% |
| Eastern Europeans | 100.0 /100 | #7 | Exceptional 7.1% |
| Immigrants | Switzerland | 100.0 /100 | #8 | Exceptional 7.1% |
| Immigrants | Taiwan | 100.0 /100 | #9 | Exceptional 7.1% |
| Immigrants | Belgium | 100.0 /100 | #10 | Exceptional 7.0% |
| Cypriots | 100.0 /100 | #11 | Exceptional 6.9% |
| Israelis | 100.0 /100 | #12 | Exceptional 6.9% |
| Immigrants | Australia | 100.0 /100 | #13 | Exceptional 6.9% |
| Immigrants | France | 100.0 /100 | #14 | Exceptional 6.8% |
| Immigrants | China | 100.0 /100 | #15 | Exceptional 6.7% |
Demographics Similar to Lithuanians by Professional Degree
In terms of professional degree, the demographic groups most similar to Lithuanians are Immigrants from Romania (5.4%, a difference of 0.10%), Ethiopian (5.4%, a difference of 0.47%), Immigrants from Western Asia (5.4%, a difference of 0.48%), Immigrants from Indonesia (5.3%, a difference of 0.61%), and Immigrants from Canada (5.3%, a difference of 0.69%).
| Demographics | Rating | Rank | Professional Degree |
| Immigrants | Bolivia | 99.9 /100 | #65 | Exceptional 5.5% |
| Immigrants | Kazakhstan | 99.9 /100 | #66 | Exceptional 5.5% |
| Immigrants | Bulgaria | 99.9 /100 | #67 | Exceptional 5.5% |
| Immigrants | Lebanon | 99.9 /100 | #68 | Exceptional 5.5% |
| Immigrants | Hungary | 99.9 /100 | #69 | Exceptional 5.5% |
| Bhutanese | 99.8 /100 | #70 | Exceptional 5.4% |
| Immigrants | Western Asia | 99.8 /100 | #71 | Exceptional 5.4% |
| Lithuanians | 99.8 /100 | #72 | Exceptional 5.4% |
| Immigrants | Romania | 99.8 /100 | #73 | Exceptional 5.4% |
| Ethiopians | 99.7 /100 | #74 | Exceptional 5.4% |
| Immigrants | Indonesia | 99.7 /100 | #75 | Exceptional 5.3% |
| Immigrants | Canada | 99.7 /100 | #76 | Exceptional 5.3% |
| Immigrants | Ethiopia | 99.7 /100 | #77 | Exceptional 5.3% |
| Armenians | 99.7 /100 | #78 | Exceptional 5.3% |
| Immigrants | North America | 99.7 /100 | #79 | Exceptional 5.3% |