Immigrants from Asia vs Hispanic or Latino 10th Grade
COMPARE
Immigrants from Asia
Hispanic or Latino
10th Grade
10th Grade Comparison
Immigrants from Asia
Hispanics or Latinos
93.4%
10TH GRADE
15.7/ 100
METRIC RATING
213th/ 347
METRIC RANK
88.9%
10TH GRADE
0.0/ 100
METRIC RATING
334th/ 347
METRIC RANK
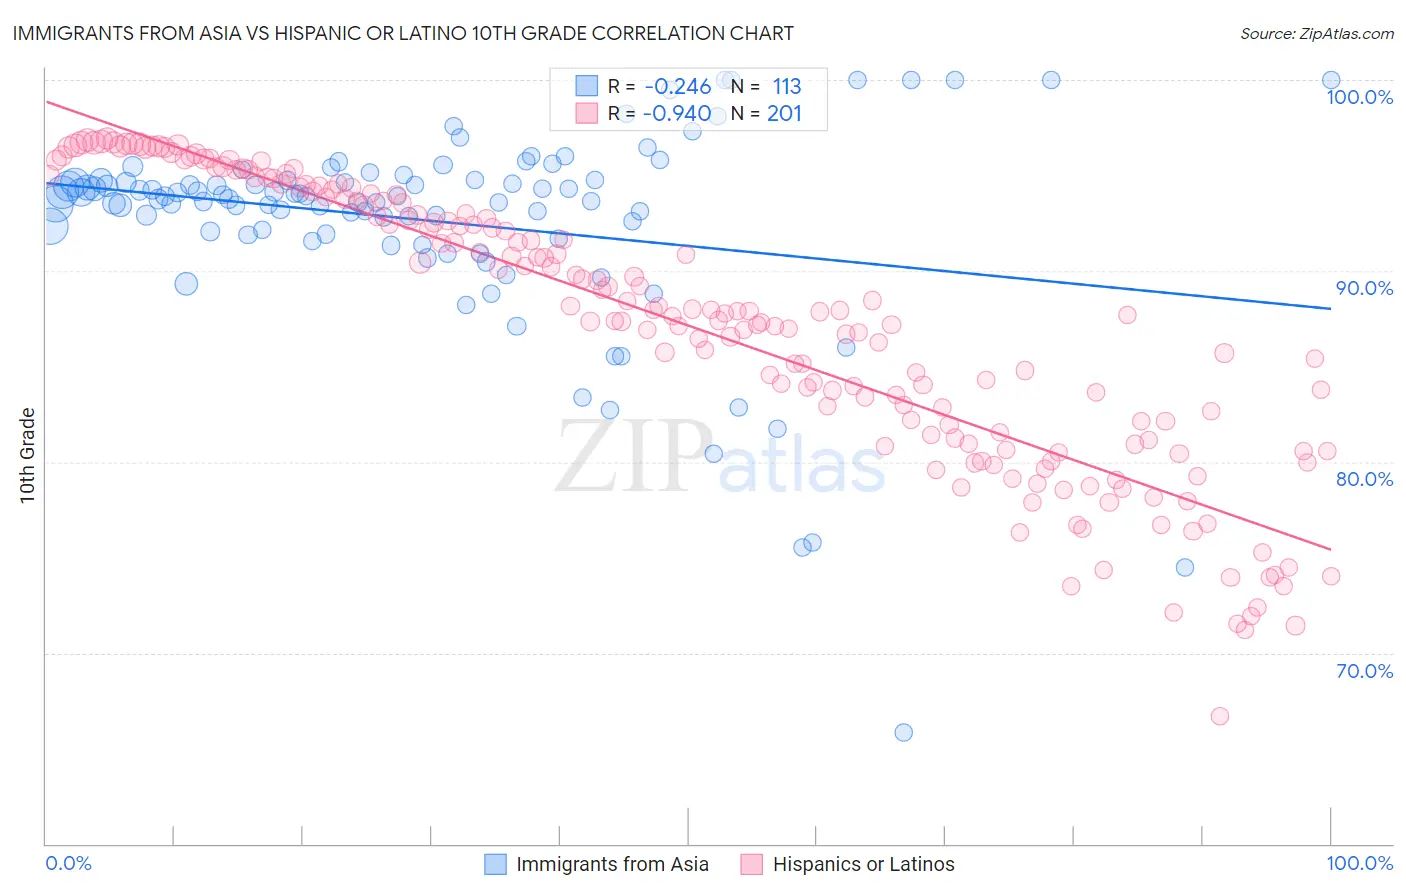
Immigrants from Asia vs Hispanic or Latino 10th Grade Correlation Chart
The statistical analysis conducted on geographies consisting of 549,170,438 people shows a weak negative correlation between the proportion of Immigrants from Asia and percentage of population with at least 10th grade education in the United States with a correlation coefficient (R) of -0.246 and weighted average of 93.4%. Similarly, the statistical analysis conducted on geographies consisting of 578,613,916 people shows a near-perfect negative correlation between the proportion of Hispanics or Latinos and percentage of population with at least 10th grade education in the United States with a correlation coefficient (R) of -0.940 and weighted average of 88.9%, a difference of 5.1%.
10th Grade Correlation Summary
| Measurement | Immigrants from Asia | Hispanic or Latino |
| Minimum | 65.9% | 66.7% |
| Maximum | 100.0% | 96.9% |
| Range | 34.1% | 30.2% |
| Mean | 92.6% | 87.1% |
| Median | 93.9% | 87.8% |
| Interquartile 25% (IQ1) | 91.9% | 81.2% |
| Interquartile 75% (IQ3) | 94.8% | 93.7% |
| Interquartile Range (IQR) | 2.9% | 12.5% |
| Standard Deviation (Sample) | 5.4% | 7.3% |
| Standard Deviation (Population) | 5.3% | 7.2% |
Similar Demographics by 10th Grade
Demographics Similar to Immigrants from Asia by 10th Grade
In terms of 10th grade, the demographic groups most similar to Immigrants from Asia are Immigrants from Bahamas (93.4%, a difference of 0.010%), Immigrants from Oceania (93.4%, a difference of 0.010%), Cajun (93.4%, a difference of 0.020%), Immigrants from Zaire (93.4%, a difference of 0.020%), and Immigrants from Eastern Africa (93.4%, a difference of 0.020%).
| Demographics | Rating | Rank | 10th Grade |
| Immigrants | Sudan | 20.0 /100 | #206 | Fair 93.4% |
| Samoans | 19.5 /100 | #207 | Poor 93.4% |
| Immigrants | Syria | 19.4 /100 | #208 | Poor 93.4% |
| Immigrants | Chile | 18.8 /100 | #209 | Poor 93.4% |
| Indians (Asian) | 17.6 /100 | #210 | Poor 93.4% |
| Cajuns | 16.9 /100 | #211 | Poor 93.4% |
| Immigrants | Zaire | 16.7 /100 | #212 | Poor 93.4% |
| Immigrants | Asia | 15.7 /100 | #213 | Poor 93.4% |
| Immigrants | Bahamas | 15.2 /100 | #214 | Poor 93.4% |
| Immigrants | Oceania | 15.1 /100 | #215 | Poor 93.4% |
| Immigrants | Eastern Africa | 14.7 /100 | #216 | Poor 93.4% |
| Portuguese | 12.1 /100 | #217 | Poor 93.3% |
| Immigrants | Liberia | 10.2 /100 | #218 | Poor 93.3% |
| Seminole | 10.2 /100 | #219 | Poor 93.3% |
| Tongans | 9.5 /100 | #220 | Tragic 93.3% |
Demographics Similar to Hispanics or Latinos by 10th Grade
In terms of 10th grade, the demographic groups most similar to Hispanics or Latinos are Honduran (89.0%, a difference of 0.12%), Immigrants from the Azores (89.0%, a difference of 0.15%), Immigrants from Dominican Republic (88.7%, a difference of 0.18%), Mexican American Indian (89.0%, a difference of 0.19%), and Immigrants from Yemen (89.1%, a difference of 0.22%).
| Demographics | Rating | Rank | 10th Grade |
| Immigrants | Nicaragua | 0.0 /100 | #327 | Tragic 89.5% |
| Immigrants | Cabo Verde | 0.0 /100 | #328 | Tragic 89.5% |
| Dominicans | 0.0 /100 | #329 | Tragic 89.4% |
| Immigrants | Yemen | 0.0 /100 | #330 | Tragic 89.1% |
| Mexican American Indians | 0.0 /100 | #331 | Tragic 89.0% |
| Immigrants | Azores | 0.0 /100 | #332 | Tragic 89.0% |
| Hondurans | 0.0 /100 | #333 | Tragic 89.0% |
| Hispanics or Latinos | 0.0 /100 | #334 | Tragic 88.9% |
| Immigrants | Dominican Republic | 0.0 /100 | #335 | Tragic 88.7% |
| Immigrants | Honduras | 0.0 /100 | #336 | Tragic 88.5% |
| Central Americans | 0.0 /100 | #337 | Tragic 88.4% |
| Immigrants | Latin America | 0.0 /100 | #338 | Tragic 88.3% |
| Guatemalans | 0.0 /100 | #339 | Tragic 87.9% |
| Mexicans | 0.0 /100 | #340 | Tragic 87.8% |
| Salvadorans | 0.0 /100 | #341 | Tragic 87.5% |