Immigrants from Micronesia vs Argentinean 9th Grade
COMPARE
Immigrants from Micronesia
Argentinean
9th Grade
9th Grade Comparison
Immigrants from Micronesia
Argentineans
94.7%
9TH GRADE
24.7/ 100
METRIC RATING
197th/ 347
METRIC RANK
94.8%
9TH GRADE
37.6/ 100
METRIC RATING
184th/ 347
METRIC RANK
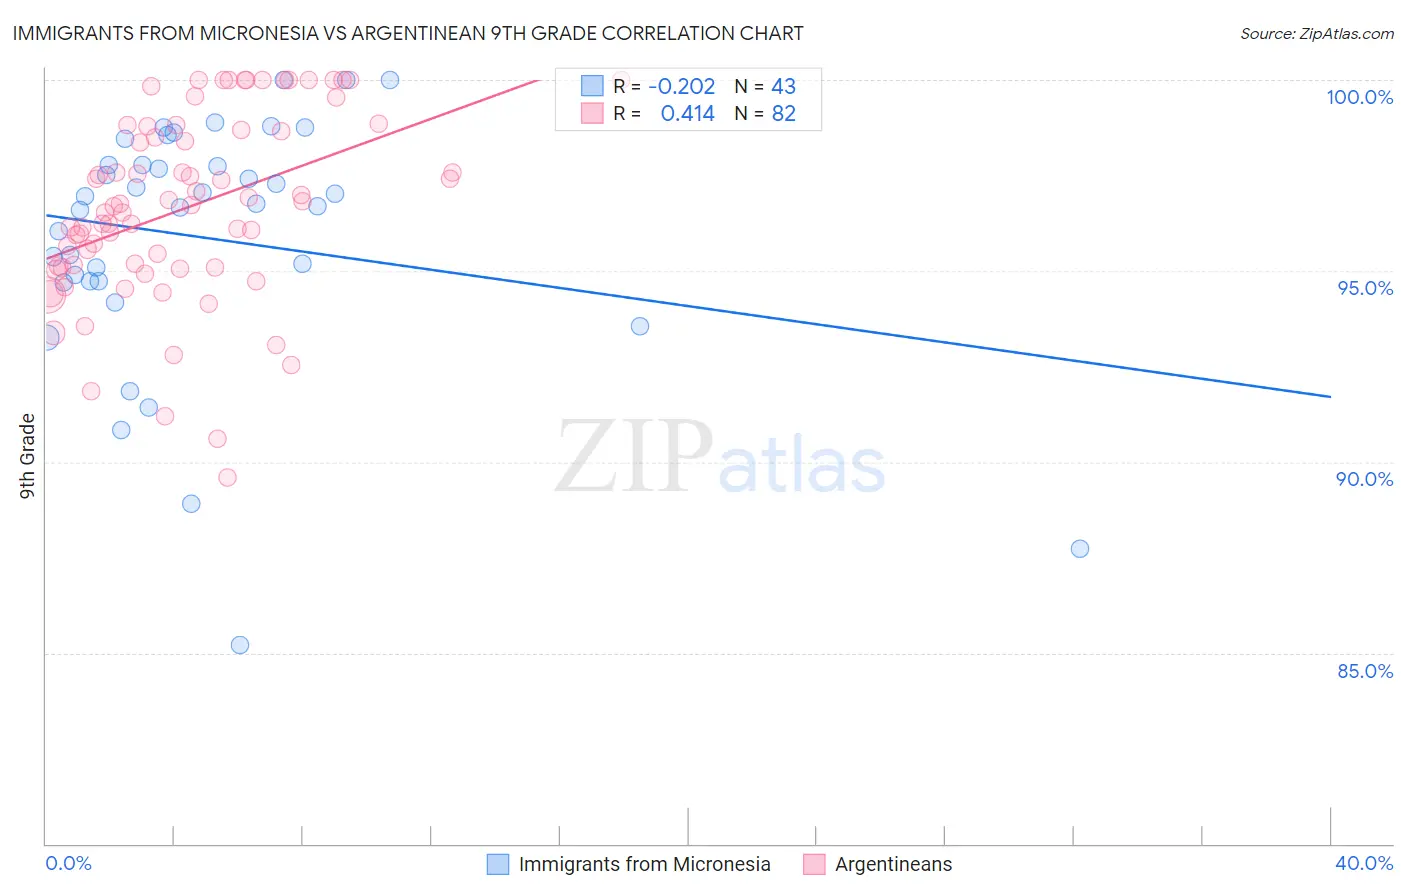
Immigrants from Micronesia vs Argentinean 9th Grade Correlation Chart
The statistical analysis conducted on geographies consisting of 61,604,657 people shows a weak negative correlation between the proportion of Immigrants from Micronesia and percentage of population with at least 9th grade education in the United States with a correlation coefficient (R) of -0.202 and weighted average of 94.7%. Similarly, the statistical analysis conducted on geographies consisting of 297,143,432 people shows a moderate positive correlation between the proportion of Argentineans and percentage of population with at least 9th grade education in the United States with a correlation coefficient (R) of 0.414 and weighted average of 94.8%, a difference of 0.11%.
9th Grade Correlation Summary
| Measurement | Immigrants from Micronesia | Argentinean |
| Minimum | 85.2% | 89.6% |
| Maximum | 100.0% | 100.0% |
| Range | 14.8% | 10.4% |
| Mean | 95.9% | 96.7% |
| Median | 96.8% | 96.7% |
| Interquartile 25% (IQ1) | 94.7% | 95.1% |
| Interquartile 75% (IQ3) | 97.8% | 98.7% |
| Interquartile Range (IQR) | 3.0% | 3.6% |
| Standard Deviation (Sample) | 3.3% | 2.4% |
| Standard Deviation (Population) | 3.2% | 2.4% |
Demographics Similar to Immigrants from Micronesia and Argentineans by 9th Grade
In terms of 9th grade, the demographic groups most similar to Immigrants from Micronesia are Immigrants from Lebanon (94.7%, a difference of 0.020%), Hawaiian (94.7%, a difference of 0.020%), Marshallese (94.7%, a difference of 0.030%), Panamanian (94.7%, a difference of 0.040%), and Laotian (94.6%, a difference of 0.040%). Similarly, the demographic groups most similar to Argentineans are Liberian (94.8%, a difference of 0.0%), Hopi (94.8%, a difference of 0.0%), Immigrants from Nepal (94.8%, a difference of 0.020%), Guamanian/Chamorro (94.8%, a difference of 0.020%), and Immigrants from Albania (94.8%, a difference of 0.020%).
| Demographics | Rating | Rank | 9th Grade |
| Immigrants | Uganda | 43.1 /100 | #180 | Average 94.8% |
| Sierra Leoneans | 42.7 /100 | #181 | Average 94.8% |
| Seminole | 42.5 /100 | #182 | Average 94.8% |
| Immigrants | Nepal | 39.7 /100 | #183 | Fair 94.8% |
| Argentineans | 37.6 /100 | #184 | Fair 94.8% |
| Liberians | 37.4 /100 | #185 | Fair 94.8% |
| Hopi | 37.1 /100 | #186 | Fair 94.8% |
| Guamanians/Chamorros | 35.5 /100 | #187 | Fair 94.8% |
| Immigrants | Albania | 34.5 /100 | #188 | Fair 94.8% |
| Immigrants | Argentina | 34.4 /100 | #189 | Fair 94.8% |
| Sudanese | 32.7 /100 | #190 | Fair 94.7% |
| Assyrians/Chaldeans/Syriacs | 32.0 /100 | #191 | Fair 94.7% |
| Immigrants | Northern Africa | 30.7 /100 | #192 | Fair 94.7% |
| Paraguayans | 30.1 /100 | #193 | Fair 94.7% |
| Panamanians | 29.0 /100 | #194 | Fair 94.7% |
| Marshallese | 27.9 /100 | #195 | Fair 94.7% |
| Immigrants | Lebanon | 27.2 /100 | #196 | Fair 94.7% |
| Immigrants | Micronesia | 24.7 /100 | #197 | Fair 94.7% |
| Hawaiians | 22.7 /100 | #198 | Fair 94.7% |
| Laotians | 21.0 /100 | #199 | Fair 94.6% |
| Immigrants | Zaire | 20.6 /100 | #200 | Fair 94.6% |