Immigrants from Micronesia vs Immigrants from Syria 9th Grade
COMPARE
Immigrants from Micronesia
Immigrants from Syria
9th Grade
9th Grade Comparison
Immigrants from Micronesia
Immigrants from Syria
94.7%
9TH GRADE
24.7/ 100
METRIC RATING
197th/ 347
METRIC RANK
94.5%
9TH GRADE
11.0/ 100
METRIC RATING
215th/ 347
METRIC RANK
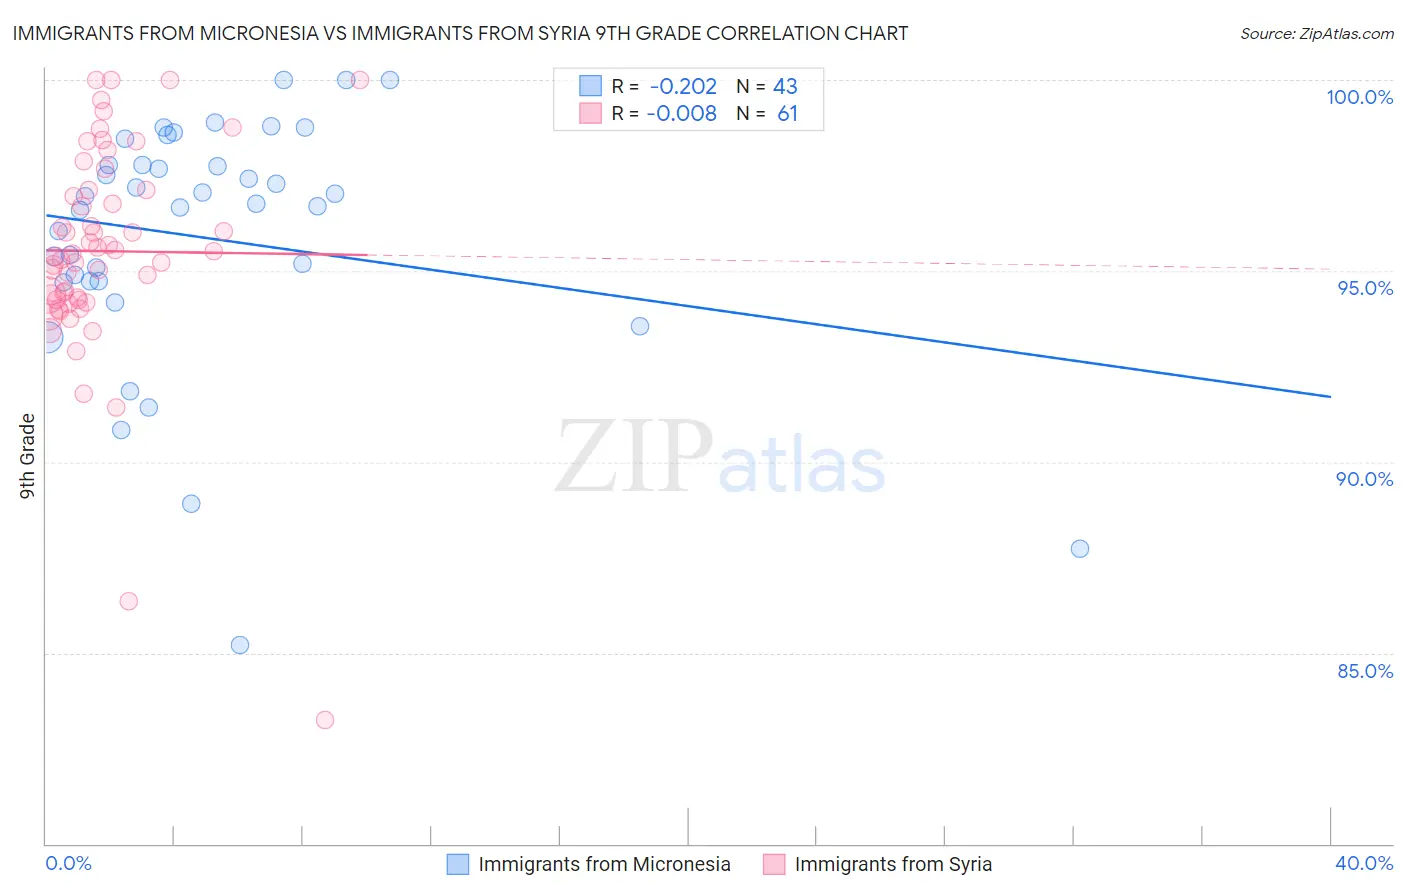
Immigrants from Micronesia vs Immigrants from Syria 9th Grade Correlation Chart
The statistical analysis conducted on geographies consisting of 61,604,657 people shows a weak negative correlation between the proportion of Immigrants from Micronesia and percentage of population with at least 9th grade education in the United States with a correlation coefficient (R) of -0.202 and weighted average of 94.7%. Similarly, the statistical analysis conducted on geographies consisting of 174,108,882 people shows no correlation between the proportion of Immigrants from Syria and percentage of population with at least 9th grade education in the United States with a correlation coefficient (R) of -0.008 and weighted average of 94.5%, a difference of 0.18%.
9th Grade Correlation Summary
| Measurement | Immigrants from Micronesia | Immigrants from Syria |
| Minimum | 85.2% | 83.2% |
| Maximum | 100.0% | 100.0% |
| Range | 14.8% | 16.8% |
| Mean | 95.9% | 95.5% |
| Median | 96.8% | 95.5% |
| Interquartile 25% (IQ1) | 94.7% | 94.2% |
| Interquartile 75% (IQ3) | 97.8% | 97.1% |
| Interquartile Range (IQR) | 3.0% | 2.9% |
| Standard Deviation (Sample) | 3.3% | 2.9% |
| Standard Deviation (Population) | 3.2% | 2.8% |
Demographics Similar to Immigrants from Micronesia and Immigrants from Syria by 9th Grade
In terms of 9th grade, the demographic groups most similar to Immigrants from Micronesia are Immigrants from Lebanon (94.7%, a difference of 0.020%), Hawaiian (94.7%, a difference of 0.020%), Laotian (94.6%, a difference of 0.040%), Immigrants from Zaire (94.6%, a difference of 0.040%), and Black/African American (94.6%, a difference of 0.040%). Similarly, the demographic groups most similar to Immigrants from Syria are Immigrants from Liberia (94.5%, a difference of 0.010%), Immigrants from Western Asia (94.5%, a difference of 0.010%), Immigrants from Indonesia (94.5%, a difference of 0.020%), Immigrants from Malaysia (94.5%, a difference of 0.020%), and Immigrants from Oceania (94.5%, a difference of 0.020%).
| Demographics | Rating | Rank | 9th Grade |
| Immigrants | Lebanon | 27.2 /100 | #196 | Fair 94.7% |
| Immigrants | Micronesia | 24.7 /100 | #197 | Fair 94.7% |
| Hawaiians | 22.7 /100 | #198 | Fair 94.7% |
| Laotians | 21.0 /100 | #199 | Fair 94.6% |
| Immigrants | Zaire | 20.6 /100 | #200 | Fair 94.6% |
| Blacks/African Americans | 20.5 /100 | #201 | Fair 94.6% |
| Immigrants | Eastern Asia | 19.8 /100 | #202 | Poor 94.6% |
| Immigrants | Bahamas | 19.8 /100 | #203 | Poor 94.6% |
| Moroccans | 19.6 /100 | #204 | Poor 94.6% |
| Immigrants | Sudan | 17.6 /100 | #205 | Poor 94.6% |
| Samoans | 17.3 /100 | #206 | Poor 94.6% |
| Immigrants | Morocco | 16.3 /100 | #207 | Poor 94.6% |
| Immigrants | Pakistan | 15.5 /100 | #208 | Poor 94.6% |
| Comanche | 14.9 /100 | #209 | Poor 94.6% |
| Immigrants | Chile | 13.4 /100 | #210 | Poor 94.5% |
| Immigrants | Indonesia | 12.3 /100 | #211 | Poor 94.5% |
| Immigrants | Malaysia | 12.2 /100 | #212 | Poor 94.5% |
| Immigrants | Oceania | 12.1 /100 | #213 | Poor 94.5% |
| Immigrants | Liberia | 11.8 /100 | #214 | Poor 94.5% |
| Immigrants | Syria | 11.0 /100 | #215 | Poor 94.5% |
| Immigrants | Western Asia | 10.7 /100 | #216 | Poor 94.5% |