Belgian vs Cambodian Family Households
COMPARE
Belgian
Cambodian
Family Households
Family Households Comparison
Belgians
Cambodians
63.8%
FAMILY HOUSEHOLDS
7.6/ 100
METRIC RATING
215th/ 347
METRIC RANK
61.4%
FAMILY HOUSEHOLDS
0.0/ 100
METRIC RATING
329th/ 347
METRIC RANK
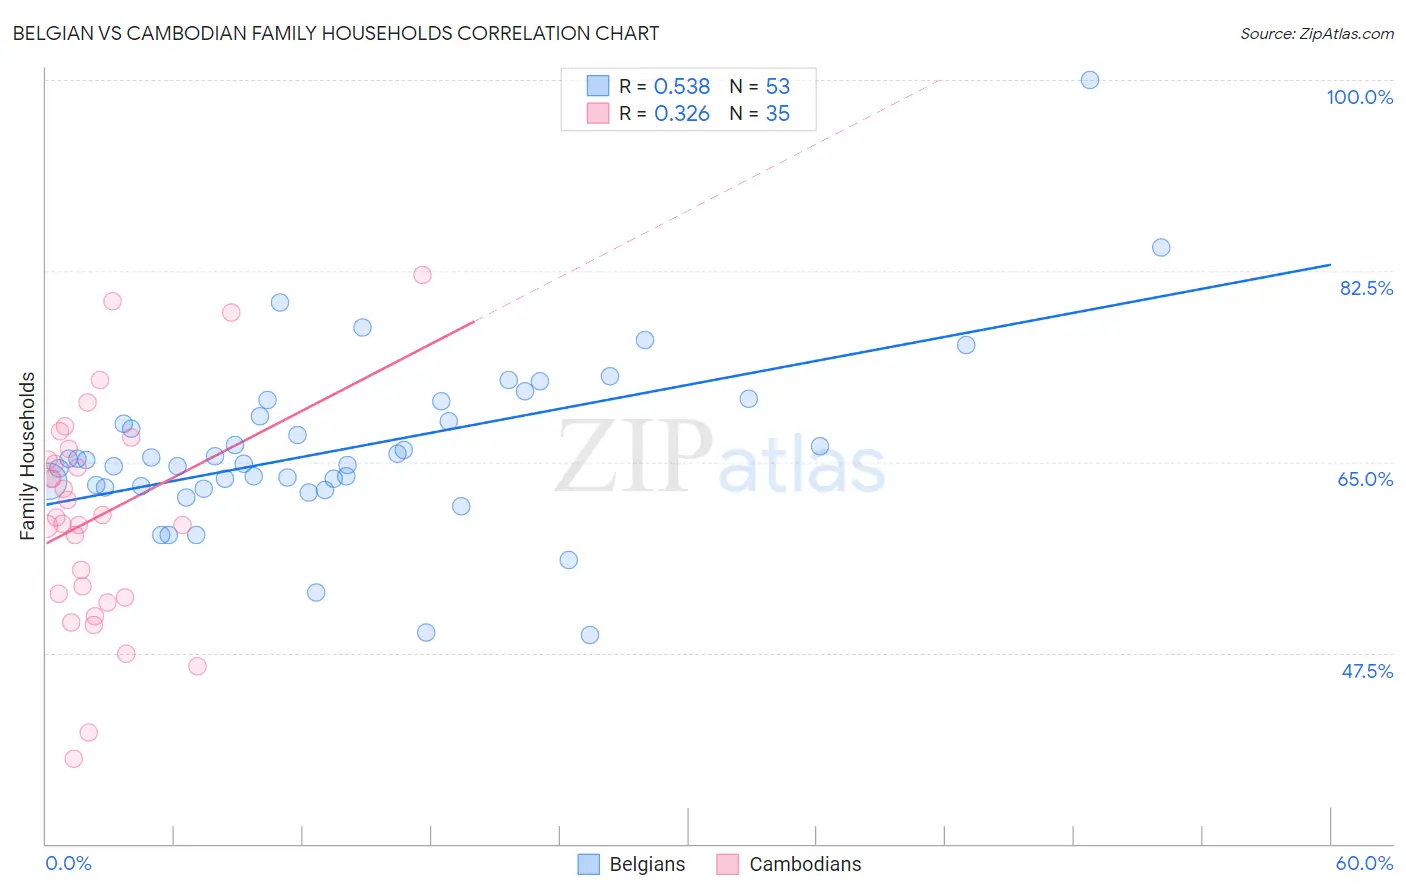
Belgian vs Cambodian Family Households Correlation Chart
The statistical analysis conducted on geographies consisting of 355,849,592 people shows a substantial positive correlation between the proportion of Belgians and percentage of family households in the United States with a correlation coefficient (R) of 0.538 and weighted average of 63.8%. Similarly, the statistical analysis conducted on geographies consisting of 102,469,130 people shows a mild positive correlation between the proportion of Cambodians and percentage of family households in the United States with a correlation coefficient (R) of 0.326 and weighted average of 61.4%, a difference of 3.9%.
Family Households Correlation Summary
| Measurement | Belgian | Cambodian |
| Minimum | 49.1% | 37.8% |
| Maximum | 100.0% | 82.2% |
| Range | 50.9% | 44.4% |
| Mean | 66.3% | 60.1% |
| Median | 65.2% | 59.9% |
| Interquartile 25% (IQ1) | 62.7% | 52.6% |
| Interquartile 75% (IQ3) | 69.8% | 66.2% |
| Interquartile Range (IQR) | 7.1% | 13.6% |
| Standard Deviation (Sample) | 8.1% | 10.2% |
| Standard Deviation (Population) | 8.1% | 10.1% |
Similar Demographics by Family Households
Demographics Similar to Belgians by Family Households
In terms of family households, the demographic groups most similar to Belgians are Celtic (63.8%, a difference of 0.020%), Croatian (63.8%, a difference of 0.020%), Osage (63.7%, a difference of 0.030%), Marshallese (63.7%, a difference of 0.030%), and Immigrants from Northern Europe (63.8%, a difference of 0.060%).
| Demographics | Rating | Rank | Family Households |
| Immigrants | Bangladesh | 11.4 /100 | #208 | Poor 63.9% |
| Sierra Leoneans | 11.2 /100 | #209 | Poor 63.9% |
| Immigrants | Thailand | 9.6 /100 | #210 | Tragic 63.8% |
| Shoshone | 9.4 /100 | #211 | Tragic 63.8% |
| Immigrants | Netherlands | 9.4 /100 | #212 | Tragic 63.8% |
| Immigrants | Northern Europe | 8.8 /100 | #213 | Tragic 63.8% |
| Celtics | 8.0 /100 | #214 | Tragic 63.8% |
| Belgians | 7.6 /100 | #215 | Tragic 63.8% |
| Croatians | 7.3 /100 | #216 | Tragic 63.8% |
| Osage | 7.0 /100 | #217 | Tragic 63.7% |
| Marshallese | 6.9 /100 | #218 | Tragic 63.7% |
| Macedonians | 6.5 /100 | #219 | Tragic 63.7% |
| Immigrants | Europe | 6.4 /100 | #220 | Tragic 63.7% |
| Immigrants | South Africa | 5.9 /100 | #221 | Tragic 63.7% |
| Immigrants | Belarus | 5.5 /100 | #222 | Tragic 63.7% |
Demographics Similar to Cambodians by Family Households
In terms of family households, the demographic groups most similar to Cambodians are Kiowa (61.4%, a difference of 0.030%), Immigrants from Australia (61.3%, a difference of 0.14%), Immigrants from France (61.3%, a difference of 0.14%), Black/African American (61.5%, a difference of 0.15%), and Indonesian (61.5%, a difference of 0.18%).
| Demographics | Rating | Rank | Family Households |
| Immigrants | Serbia | 0.0 /100 | #322 | Tragic 61.6% |
| Tlingit-Haida | 0.0 /100 | #323 | Tragic 61.6% |
| Immigrants | West Indies | 0.0 /100 | #324 | Tragic 61.6% |
| Immigrants | Switzerland | 0.0 /100 | #325 | Tragic 61.6% |
| Indonesians | 0.0 /100 | #326 | Tragic 61.5% |
| Blacks/African Americans | 0.0 /100 | #327 | Tragic 61.5% |
| Kiowa | 0.0 /100 | #328 | Tragic 61.4% |
| Cambodians | 0.0 /100 | #329 | Tragic 61.4% |
| Immigrants | Australia | 0.0 /100 | #330 | Tragic 61.3% |
| Immigrants | France | 0.0 /100 | #331 | Tragic 61.3% |
| Ethiopians | 0.0 /100 | #332 | Tragic 61.2% |
| Immigrants | Ethiopia | 0.0 /100 | #333 | Tragic 61.2% |
| Immigrants | Eastern Africa | 0.0 /100 | #334 | Tragic 61.1% |
| Carpatho Rusyns | 0.0 /100 | #335 | Tragic 61.1% |
| German Russians | 0.0 /100 | #336 | Tragic 60.9% |